
Disclaimer:
This analysis is for educational purposes only. I am not a SEBI-registered advisor. This is not financial advice.
Symbol: AXISBANK (NSE)
Date Observed: 11 March 2024
Time Frame: 15-Minute Chart
Method: Gann Square of 9 (Price Capacity & Time Alignment)
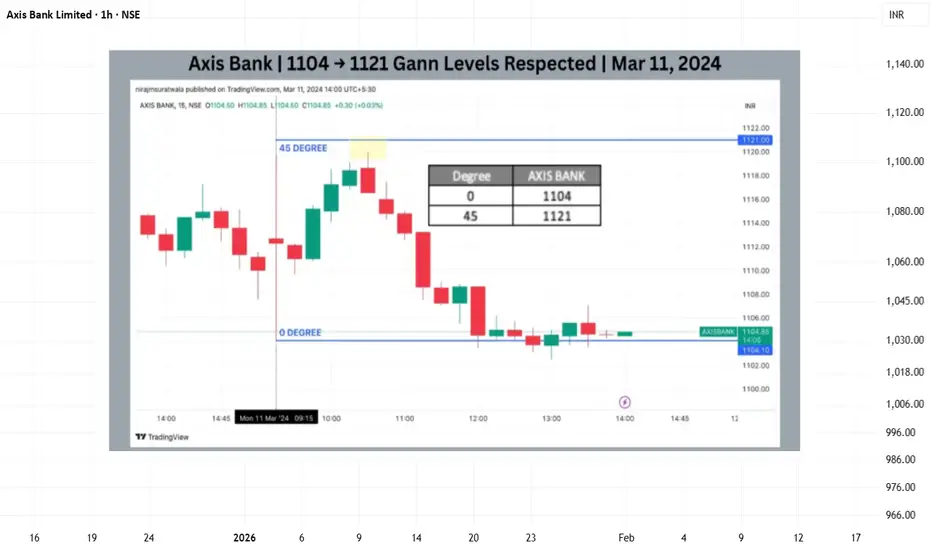
This post shares a historical intraday observation showing how price interacted with a normal Square of 9 capacity level, leading to a temporary reaction when time and price aligned.
📊 Market Context & Reference Selection
🔢 Square of 9 Level Mapping
⏱️ Observed Price–Time Behavior
📘 Educational Takeaways
📌 Shared strictly for educational and historical chart-study purposes.
#AxisBank #GannSquareOf9 #WDGann #IntradayAnalysis #MarketEducation #PriceTime #TechnicalAnalysis
This analysis is for educational purposes only. I am not a SEBI-registered advisor. This is not financial advice.
Symbol: AXISBANK (NSE)
Date Observed: 11 March 2024
Time Frame: 15-Minute Chart
Method: Gann Square of 9 (Price Capacity & Time Alignment)
This post shares a historical intraday observation showing how price interacted with a normal Square of 9 capacity level, leading to a temporary reaction when time and price aligned.
📊 Market Context & Reference Selection
- Axis Bank displayed upward momentum after the completion of the first 15-minute candle.
- In such market conditions, the low of the first 15-minute candle (~1104) was treated as the 0-degree reference level, following Gann methodology.
- This reference point was used to study the session’s expected price expansion.
- Correct identification of the reference level is critical for objective Square of 9 analysis.
🔢 Square of 9 Level Mapping
- Based on the selected reference:
- 0 Degree: ~1104
- 45 Degree (Observed Normal Capacity): ~1121
- The 45-degree level often represents the normal intraday movement range under regular market conditions.
⏱️ Observed Price–Time Behavior
- Price approached the 45-degree level well before the later part of the trading session.
- Early completion of normal price capacity has historically been associated with short-term trend fatigue.
- After interacting with this zone, price showed temporary selling pressure and moved lower.
- A minor variation around the calculated level was observed, which is common in live market conditions.
- This aligns with a widely observed Gann concept:
- When expected price capacity is completed early in time, the probability of a reaction may increase.
📘 Educational Takeaways
- Square of 9 helps define logical intraday price limits
- Early capacity completion can indicate temporary exhaustion
- Time plays a supporting role in validating price-degree levels
- Small price deviations are normal and should be viewed structurally
- The method promotes rule-based observation over prediction
📌 Shared strictly for educational and historical chart-study purposes.
#AxisBank #GannSquareOf9 #WDGann #IntradayAnalysis #MarketEducation #PriceTime #TechnicalAnalysis

פרסומים קשורים
כתב ויתור
המידע והפרסומים אינם מיועדים להיות, ואינם מהווים, ייעוץ או המלצה פיננסית, השקעתית, מסחרית או מכל סוג אחר המסופקת או מאושרת על ידי TradingView. קרא עוד ב־תנאי השימוש.
פרסומים קשורים
כתב ויתור
המידע והפרסומים אינם מיועדים להיות, ואינם מהווים, ייעוץ או המלצה פיננסית, השקעתית, מסחרית או מכל סוג אחר המסופקת או מאושרת על ידי TradingView. קרא עוד ב־תנאי השימוש.