
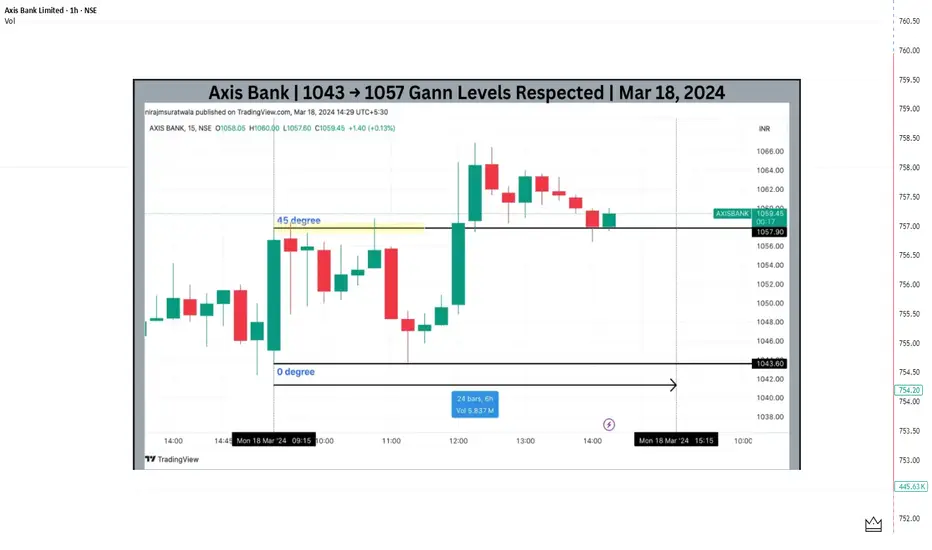
This idea presents an intraday case study showing how price reacted to a key Gann Square of 9 angle level. (Educational)
On 18 March 2024, Axis Bank showed strength from the first 15-minute candle.
The low of the first 15-minute candle near 1043 was used as the 0-degree reference, following WD Gann’s price–angle methodology.
Using Square of 9 calculations, the following level was derived:
45° level → 1057
Price reached the 45-degree level very early in the session (around 9:45 AM), much before the commonly observed time balance later in the day.
This early completion of price expansion indicated a price–time imbalance.
After testing the 45° zone, Axis Bank showed rejection and reversal, resulting in a clean intraday pullback from that level.
🔍 Key Observations
This example highlights how price, time, and angle alignment can be studied systematically in intraday trading.
Disclaimer:
This idea is shared strictly for educational and chart-analysis purposes only.
It does not represent trading advice or recommendations.
On 18 March 2024, Axis Bank showed strength from the first 15-minute candle.
The low of the first 15-minute candle near 1043 was used as the 0-degree reference, following WD Gann’s price–angle methodology.
Using Square of 9 calculations, the following level was derived:
45° level → 1057
Price reached the 45-degree level very early in the session (around 9:45 AM), much before the commonly observed time balance later in the day.
This early completion of price expansion indicated a price–time imbalance.
After testing the 45° zone, Axis Bank showed rejection and reversal, resulting in a clean intraday pullback from that level.
🔍 Key Observations
- Define the 0-degree base from early intraday structure
- Use 45° as normal price expansion
- Early arrival at angle levels can indicate exhaustion
- Gann geometry helps identify logical reaction zones, not guesses
This example highlights how price, time, and angle alignment can be studied systematically in intraday trading.
Disclaimer:
This idea is shared strictly for educational and chart-analysis purposes only.
It does not represent trading advice or recommendations.

פרסומים קשורים
כתב ויתור
המידע והפרסומים אינם מיועדים להיות, ואינם מהווים, ייעוץ או המלצה פיננסית, השקעתית, מסחרית או מכל סוג אחר המסופקת או מאושרת על ידי TradingView. קרא עוד ב־תנאי השימוש.
פרסומים קשורים
כתב ויתור
המידע והפרסומים אינם מיועדים להיות, ואינם מהווים, ייעוץ או המלצה פיננסית, השקעתית, מסחרית או מכל סוג אחר המסופקת או מאושרת על ידי TradingView. קרא עוד ב־תנאי השימוש.