
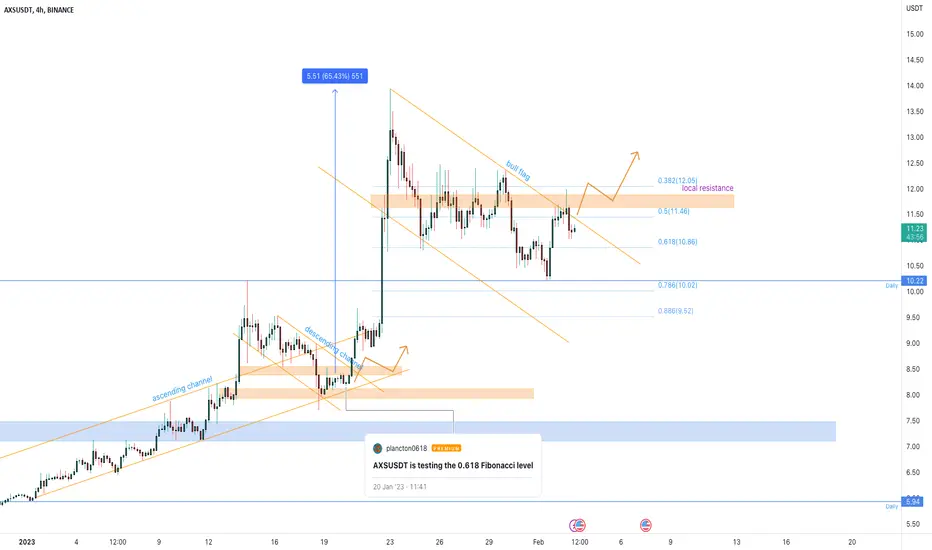
AXSUSDT is inside the bull flag
A bullflag is a chart pattern that occurs in an upward trending market and is characterized by a period of consolidation or retracement within a parallel channel, creating a flag-like shape. The pattern is considered bullish as it often precedes a continuation of the uptrend.
In this case, AXSUSDT is testing the 0.618 Fibonacci level inside a bullflag formation.
The price has increased 63% since the previous idea after a clear breakout from a descending channel. Additionally, the price created an engulfing pattern on the daily support at the 10$ area, which could be a bullish signal, so According to Plancton's strategy, we can set a nice order
–––––
Keep in mind.
–––––
Follow the Shrimp 🦐
A bullflag is a chart pattern that occurs in an upward trending market and is characterized by a period of consolidation or retracement within a parallel channel, creating a flag-like shape. The pattern is considered bullish as it often precedes a continuation of the uptrend.
In this case, AXSUSDT is testing the 0.618 Fibonacci level inside a bullflag formation.
The price has increased 63% since the previous idea after a clear breakout from a descending channel. Additionally, the price created an engulfing pattern on the daily support at the 10$ area, which could be a bullish signal, so According to Plancton's strategy, we can set a nice order
–––––
Keep in mind.
- 🟣 Purple structure -> Monthly structure.
- 🔴 Red structure -> Weekly structure.
- 🔵 Blue structure -> Daily structure.
- 🟡 Yellow structure -> 4h structure.
- ⚫️ black structure -> <= 1h structure.
–––––
Follow the Shrimp 🦐
הערה
no breakout so farהערה
Waiting for the breakoutהערה
8% 
כתב ויתור
המידע והפרסומים אינם מיועדים להיות, ואינם מהווים, ייעוץ או המלצה פיננסית, השקעתית, מסחרית או מכל סוג אחר המסופקת או מאושרת על ידי TradingView. קרא עוד ב־תנאי השימוש.
כתב ויתור
המידע והפרסומים אינם מיועדים להיות, ואינם מהווים, ייעוץ או המלצה פיננסית, השקעתית, מסחרית או מכל סוג אחר המסופקת או מאושרת על ידי TradingView. קרא עוד ב־תנאי השימוש.