
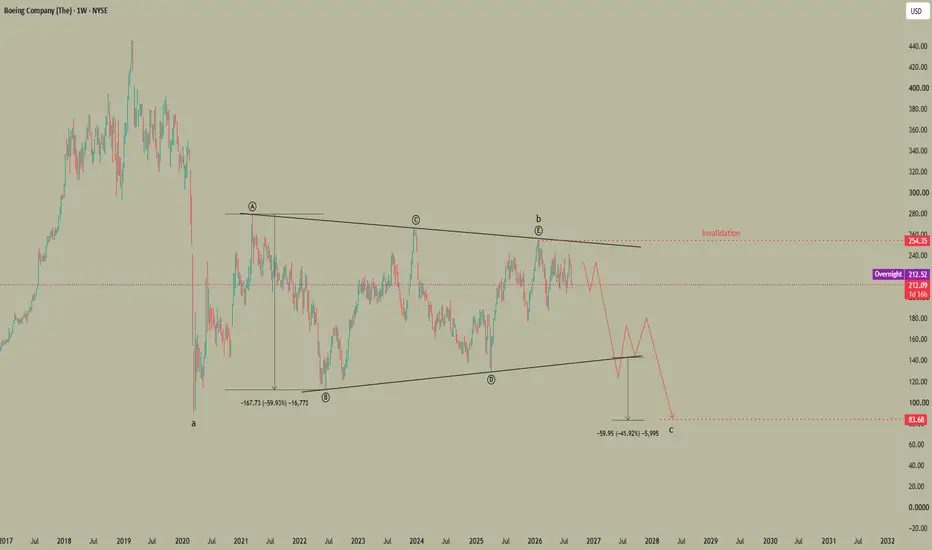
Boeing has been painting a pretty clear symmetrical triangle pattern between 2020 and 2026 which could be ABCDE waves for wave B.
Triangles formed after a bear trend tend to lead to a continuation of the bear trend so could expect the triangle lower trendline to be tested and broken in the future to complete wave C.
Invalidation would be a break above wave E at $254.
You can use Bulkowskis method for calculating targets for triangle breakouts:
thepatternsite.com/st.html
Compute the height from the highest peak to the lowest valley in the triangle pattern then multiply it by 36%. Add it (upward breakouts) or subtract it (downward breakouts) from the breakout price; that puts a target around $84 (depending exactly where the triangle breaks on the downside).
Triangles formed after a bear trend tend to lead to a continuation of the bear trend so could expect the triangle lower trendline to be tested and broken in the future to complete wave C.
Invalidation would be a break above wave E at $254.
You can use Bulkowskis method for calculating targets for triangle breakouts:
thepatternsite.com/st.html
Compute the height from the highest peak to the lowest valley in the triangle pattern then multiply it by 36%. Add it (upward breakouts) or subtract it (downward breakouts) from the breakout price; that puts a target around $84 (depending exactly where the triangle breaks on the downside).

כתב ויתור
המידע והפרסומים אינם מיועדים להיות, ואינם מהווים, ייעוץ או המלצה פיננסית, השקעתית, מסחרית או מכל סוג אחר המסופקת או מאושרת על ידי TradingView. קרא עוד ב־תנאי השימוש.
כתב ויתור
המידע והפרסומים אינם מיועדים להיות, ואינם מהווים, ייעוץ או המלצה פיננסית, השקעתית, מסחרית או מכל סוג אחר המסופקת או מאושרת על ידי TradingView. קרא עוד ב־תנאי השימוש.