
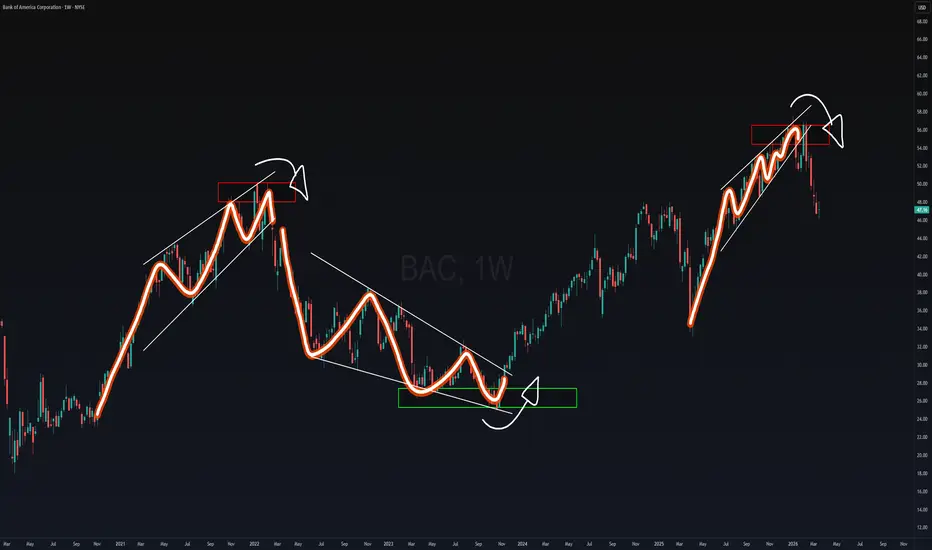
Best way to spot chart patterns are by simply looking for the loss in momentum and linking the external points to outline the pattern your looking for.
I'll stick to just one textbook pattern to keep it simple for now.
LOSS IN MOMENTUM

In this first example starting from the left side of the chart we can see buyers lose momentum by identifying external points and visually looking for exhaustion as price continues to rise.
Same goes with the sellers when price declines. Momentum dies off and hands the power back over to bulls.
PATTERN

Now that we spotted the loss in momentum we can link those external points to create a visual representation of a wedged-like shape.
BREAKOUT

A squeeze is now created at the smallest point of the shape and this is where the breakout occurs.
BONUS

Another way to make sure these patterns are valid and powerful is by looking for areas of liquidity and or levels of support/resistance.
Hope this was educational and helpful as it could strengthen your current strategy or if your a beginner this may have been very insightful, enjoy! :)
I'll stick to just one textbook pattern to keep it simple for now.
LOSS IN MOMENTUM
In this first example starting from the left side of the chart we can see buyers lose momentum by identifying external points and visually looking for exhaustion as price continues to rise.
Same goes with the sellers when price declines. Momentum dies off and hands the power back over to bulls.
PATTERN
Now that we spotted the loss in momentum we can link those external points to create a visual representation of a wedged-like shape.
BREAKOUT
A squeeze is now created at the smallest point of the shape and this is where the breakout occurs.
BONUS
Another way to make sure these patterns are valid and powerful is by looking for areas of liquidity and or levels of support/resistance.
Hope this was educational and helpful as it could strengthen your current strategy or if your a beginner this may have been very insightful, enjoy! :)

NathanAL
כתב ויתור
המידע והפרסומים אינם מיועדים להיות, ואינם מהווים, ייעוץ או המלצה פיננסית, השקעתית, מסחרית או מכל סוג אחר המסופקת או מאושרת על ידי TradingView. קרא עוד ב־תנאי השימוש.
NathanAL
כתב ויתור
המידע והפרסומים אינם מיועדים להיות, ואינם מהווים, ייעוץ או המלצה פיננסית, השקעתית, מסחרית או מכל סוג אחר המסופקת או מאושרת על ידי TradingView. קרא עוד ב־תנאי השימוש.