
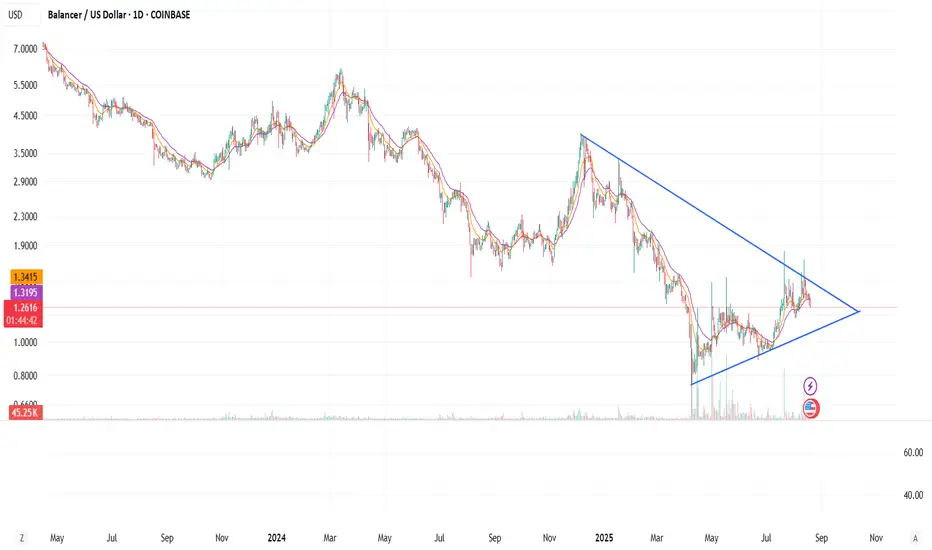
BAL/USDT – Symmetrical Triangle Breakout Watch 🚀
Balancer is currently trading inside a well-formed symmetrical triangle on the daily timeframe. The price has been consolidating between $1.10 support and $1.50 resistance, and is now approaching the apex of the pattern – a breakout move looks imminent.
🔹 Pattern: Symmetrical Triangle (valid structure, converging trendlines)
🔹 Support: ~$1.10 – $1.15
🔹 Resistance: ~$1.45 – $1.50
Breakout Scenarios:
✅ Bullish Case:
A decisive breakout above $1.50 with strong volume could trigger a rally. Based on the triangle’s height, the measured move target projects towards $4.00 – $4.80. Key levels to watch on the way up are $1.90 → $2.30 → $3.00.
❌ Bearish Case:
A breakdown below $1.10 may invalidate the setup, with possible retests of $0.85 and even $0.65.
Balancer is currently trading inside a well-formed symmetrical triangle on the daily timeframe. The price has been consolidating between $1.10 support and $1.50 resistance, and is now approaching the apex of the pattern – a breakout move looks imminent.
🔹 Pattern: Symmetrical Triangle (valid structure, converging trendlines)
🔹 Support: ~$1.10 – $1.15
🔹 Resistance: ~$1.45 – $1.50
Breakout Scenarios:
✅ Bullish Case:
A decisive breakout above $1.50 with strong volume could trigger a rally. Based on the triangle’s height, the measured move target projects towards $4.00 – $4.80. Key levels to watch on the way up are $1.90 → $2.30 → $3.00.
❌ Bearish Case:
A breakdown below $1.10 may invalidate the setup, with possible retests of $0.85 and even $0.65.

כתב ויתור
המידע והפרסומים אינם מיועדים להיות, ואינם מהווים, ייעוץ או המלצה פיננסית, השקעתית, מסחרית או מכל סוג אחר המסופקת או מאושרת על ידי TradingView. קרא עוד ב־תנאי השימוש.
כתב ויתור
המידע והפרסומים אינם מיועדים להיות, ואינם מהווים, ייעוץ או המלצה פיננסית, השקעתית, מסחרית או מכל סוג אחר המסופקת או מאושרת על ידי TradingView. קרא עוד ב־תנאי השימוש.