השכלה
Double bottom - BALUSDT Review 📚
Good day everyone.
Today I'll be discussing on the double bottom trend reversal pattern.
1. DEFINITION
What is a Double Bottom?
A double bottom pattern is a technical analysis charting pattern that describes a change in trend and a momentum reversal from prior leading price action. It describes the drop of a stock or index, a rebound, another drop to the same or similar level as the original drop, and finally another rebound. The double bottom looks like the letter "W". The twice-touched low is considered a support level.
2. ENTRY
The entry ( buy order) in double bottom pattern is placed just above the neckline resistance.
3. TARGET ( TAKE PROFIT)
The target of a double bottom pattern = the distance of the bottom head to the neckline resistance.
When a double bottom is spotted in a channel or rectangular pattern support. Your target should be the channel resistance and rectangular pattern resistance respectively.
4. STOP LOSS AND SETUP INVALIDATION
The setup invalidation is a breakdown below the double bottom support.
The stop loss is half the distance of the setup invalidation.
5.TRADE EXAMPLE
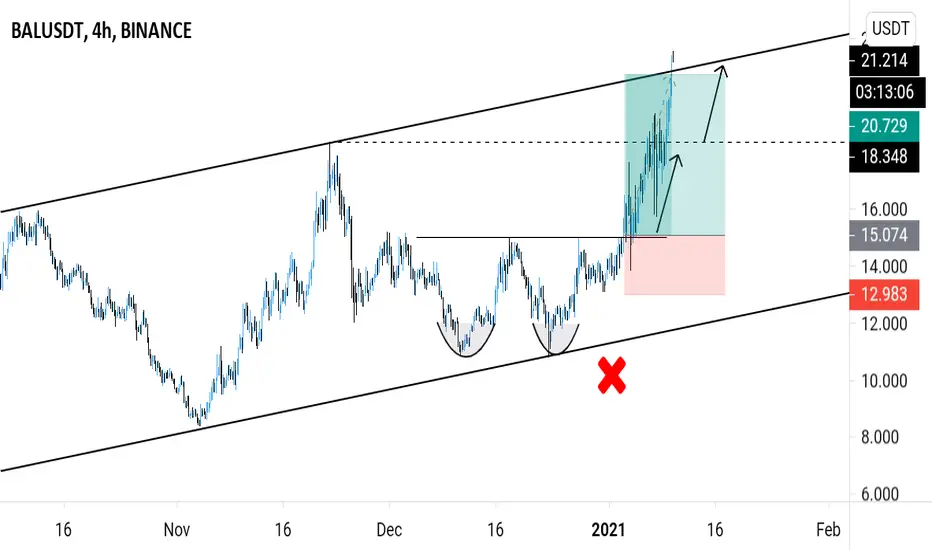
I'll be using my analysis on BALUSDT as a trade example on double bottom.
The trade played out as expected from my previous analysis.
My buy entry ⬆️ - breakout above the double bottom neckline resistance.
My targets 🎯 - previous swing high, ascending channel resistance.
My setup invalidation ❌ - breakdown below the double bottom support + ascending channel support.
My stop loss 🔴 - setup invalidation / 2.
Today I'll be discussing on the double bottom trend reversal pattern.
1. DEFINITION
What is a Double Bottom?
A double bottom pattern is a technical analysis charting pattern that describes a change in trend and a momentum reversal from prior leading price action. It describes the drop of a stock or index, a rebound, another drop to the same or similar level as the original drop, and finally another rebound. The double bottom looks like the letter "W". The twice-touched low is considered a support level.
2. ENTRY
The entry ( buy order) in double bottom pattern is placed just above the neckline resistance.
3. TARGET ( TAKE PROFIT)
The target of a double bottom pattern = the distance of the bottom head to the neckline resistance.
When a double bottom is spotted in a channel or rectangular pattern support. Your target should be the channel resistance and rectangular pattern resistance respectively.
4. STOP LOSS AND SETUP INVALIDATION
The setup invalidation is a breakdown below the double bottom support.
The stop loss is half the distance of the setup invalidation.
5.TRADE EXAMPLE
I'll be using my analysis on BALUSDT as a trade example on double bottom.
The trade played out as expected from my previous analysis.
My buy entry ⬆️ - breakout above the double bottom neckline resistance.
My targets 🎯 - previous swing high, ascending channel resistance.
My setup invalidation ❌ - breakdown below the double bottom support + ascending channel support.
My stop loss 🔴 - setup invalidation / 2.

פרסומים קשורים
כתב ויתור
המידע והפרסומים אינם מיועדים להיות, ואינם מהווים, ייעוץ או המלצה פיננסית, השקעתית, מסחרית או מכל סוג אחר המסופקת או מאושרת על ידי TradingView. קרא עוד ב־תנאי השימוש.
פרסומים קשורים
כתב ויתור
המידע והפרסומים אינם מיועדים להיות, ואינם מהווים, ייעוץ או המלצה פיננסית, השקעתית, מסחרית או מכל סוג אחר המסופקת או מאושרת על ידי TradingView. קרא עוד ב־תנאי השימוש.