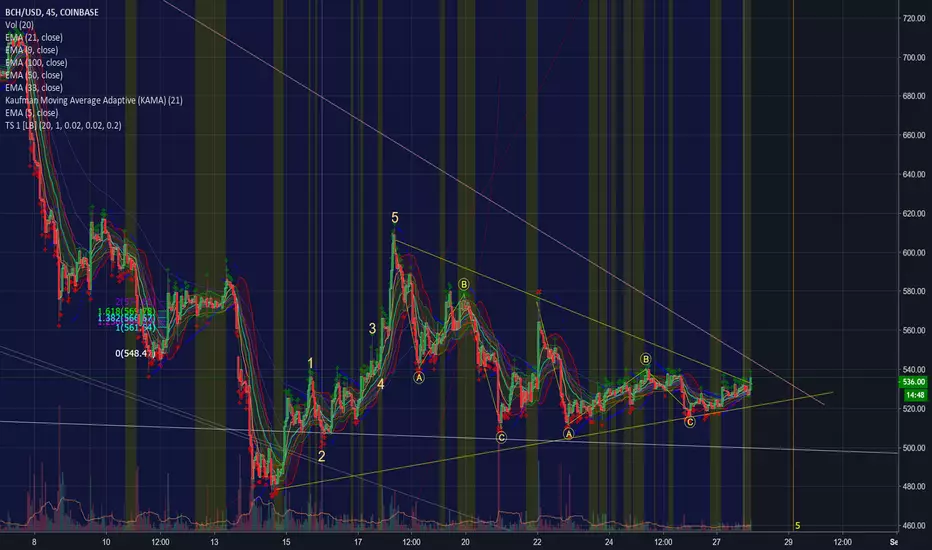
 BCHUSD is poised for a BREAK-OUT!
Technical Analysis:
BCHUSD has been in a Bear Market Rally and has been consolidating for almost 8 months now. 1. Overall Chart (Weekly)
a. Regression channel since inception shows the price is in the UPPER channel and has been trending in the middle of the regression channel
b. White Trend lines show a large descinding triangle formation
2. Overall Chart (6Hr)
a. Small Triangle formation
b. Bolinger Bands and Keltner Channel Squeeze
3. Overall Chart (45Min)
a. Small 5 Wave Cycle and a Complex Correction
Ran out of time but will update soon.
-AB
הערה
Fibonacci Analysis and Targets.
-AB
הערה
Spiral Analysis
X Marks the Spot!
הערה
BCH has broken out as expected.
הערה
הערה
Wave Formation to mark the end of the correction?
הערה
Wave 3 targets=1-1.618
STOP=$524
הערה
Higher Degree Wave 3 Targets
הערה
Why the stop at $524.00?
Rules of Waves
הערה
Overview
הערה
Looks like the LOWER DEGREE Wave 3 is extending because it blew by the 1.618 Level. הערה
Confirmed Breakout.

פרסומים קשורים
כתב ויתור
המידע והפרסומים אינם מיועדים להיות, ואינם מהווים, ייעוץ או המלצה פיננסית, השקעתית, מסחרית או מכל סוג אחר המסופקת או מאושרת על ידי TradingView. קרא עוד ב־תנאי השימוש.
כתב ויתור
המידע והפרסומים אינם מיועדים להיות, ואינם מהווים, ייעוץ או המלצה פיננסית, השקעתית, מסחרית או מכל סוג אחר המסופקת או מאושרת על ידי TradingView. קרא עוד ב־תנאי השימוש.