
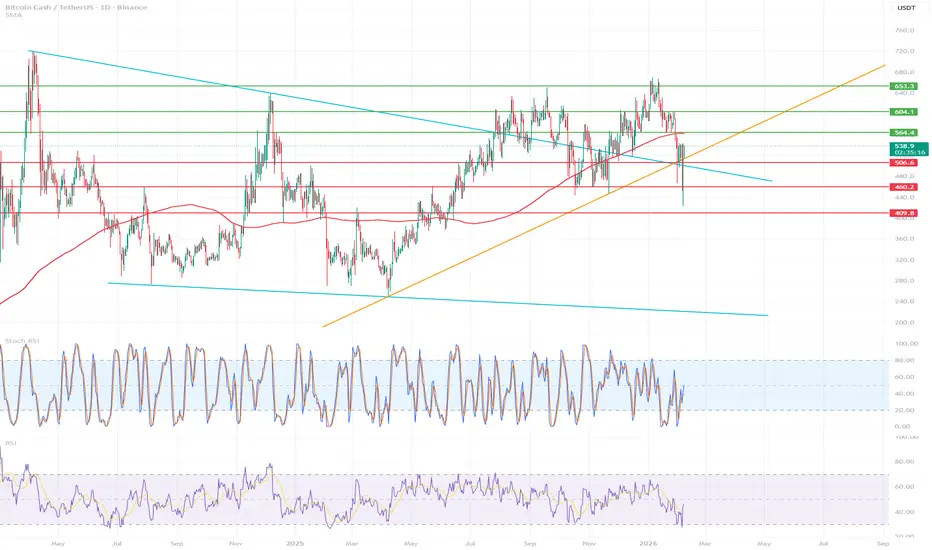
🧭 Market Structure (HTF – Daily)
📉 Trend
Long-term: uptrend (orange trend line)
Medium-term: correction in an uptrend
Currently, the price has broken the local HH → HL structure and returned to important levels.
This is NOT a downtrend reversal yet, but a warning.
🧱 Key Levels (you've got this one figured out)
🟢 Resistance
564 USDT – mega-important (local S/R + trend intersection)
604 USDT
653 USDT – main HTF resistance
No D1 close above 564 → no confirmation of bullish strength.
🔴 Supports
506 USDT – currently being tested (local S/R)
460 USDT – very strong support (reactions + structure)
409 USDT – last line of defense, things get ugly below
📐 Trendlines
The blue bearish (HTF) has been rejected
The price has fallen below the crossover:
uptrend
MA (red)
👉 This is a classic corrective signal, not a panic signal.
📊 RSI & Stoch RSI
RSI (lower panel)
RSI ~ 40
Not oversold yet
No bullish divergence on D1
➡️ There is room for a further decline before a strong bounce occurs.
Stoch RSI
Often in extreme zones → nervous market
Currently not giving a clear long signal
🔮 Scenarios (most important)
🟡 Baseline scenario (most likely)
Consolidation / drop to:
460 USDT
There:
demand reaction
potential higher low
Only then an attempt to attack 564 → 604
👉 A healthy correction in the uptrend.
🔴 Negative scenario
Daily close < 460
Then:
quick move to 409
deeper accumulation possible
This would be a signal of medium-term weakness.
🟢 Bullish scenario (less likely NOW)
Quick return above:
506 → 540
Daily close > 564
Targets:
604
653
Without this, every raise is a pullback.
📉 Trend
Long-term: uptrend (orange trend line)
Medium-term: correction in an uptrend
Currently, the price has broken the local HH → HL structure and returned to important levels.
This is NOT a downtrend reversal yet, but a warning.
🧱 Key Levels (you've got this one figured out)
🟢 Resistance
564 USDT – mega-important (local S/R + trend intersection)
604 USDT
653 USDT – main HTF resistance
No D1 close above 564 → no confirmation of bullish strength.
🔴 Supports
506 USDT – currently being tested (local S/R)
460 USDT – very strong support (reactions + structure)
409 USDT – last line of defense, things get ugly below
📐 Trendlines
The blue bearish (HTF) has been rejected
The price has fallen below the crossover:
uptrend
MA (red)
👉 This is a classic corrective signal, not a panic signal.
📊 RSI & Stoch RSI
RSI (lower panel)
RSI ~ 40
Not oversold yet
No bullish divergence on D1
➡️ There is room for a further decline before a strong bounce occurs.
Stoch RSI
Often in extreme zones → nervous market
Currently not giving a clear long signal
🔮 Scenarios (most important)
🟡 Baseline scenario (most likely)
Consolidation / drop to:
460 USDT
There:
demand reaction
potential higher low
Only then an attempt to attack 564 → 604
👉 A healthy correction in the uptrend.
🔴 Negative scenario
Daily close < 460
Then:
quick move to 409
deeper accumulation possible
This would be a signal of medium-term weakness.
🟢 Bullish scenario (less likely NOW)
Quick return above:
506 → 540
Daily close > 564
Targets:
604
653
Without this, every raise is a pullback.

כתב ויתור
המידע והפרסומים אינם מיועדים להיות, ואינם מהווים, ייעוץ או המלצה פיננסית, השקעתית, מסחרית או מכל סוג אחר המסופקת או מאושרת על ידי TradingView. קרא עוד ב־תנאי השימוש.
כתב ויתור
המידע והפרסומים אינם מיועדים להיות, ואינם מהווים, ייעוץ או המלצה פיננסית, השקעתית, מסחרית או מכל סוג אחר המסופקת או מאושרת על ידי TradingView. קרא עוד ב־תנאי השימוש.