
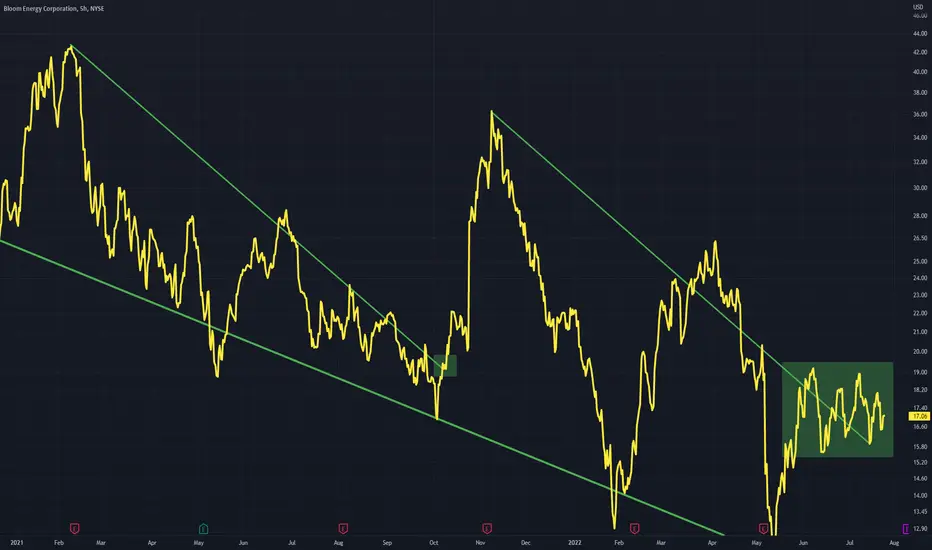
Two falling wedges can be drawn on chart
The first showing a successful breakout, leading to the peak of the second falling wedge
This second falling wedge may not have bottomed but the break out should occur along the green downtrend line
The first showing a successful breakout, leading to the peak of the second falling wedge
This second falling wedge may not have bottomed but the break out should occur along the green downtrend line

כתב ויתור
המידע והפרסומים אינם מיועדים להיות, ואינם מהווים, ייעוץ או המלצה פיננסית, השקעתית, מסחרית או מכל סוג אחר המסופקת או מאושרת על ידי TradingView. קרא עוד ב־תנאי השימוש.
כתב ויתור
המידע והפרסומים אינם מיועדים להיות, ואינם מהווים, ייעוץ או המלצה פיננסית, השקעתית, מסחרית או מכל סוג אחר המסופקת או מאושרת על ידי TradingView. קרא עוד ב־תנאי השימוש.