לונג
BLOKUSDT
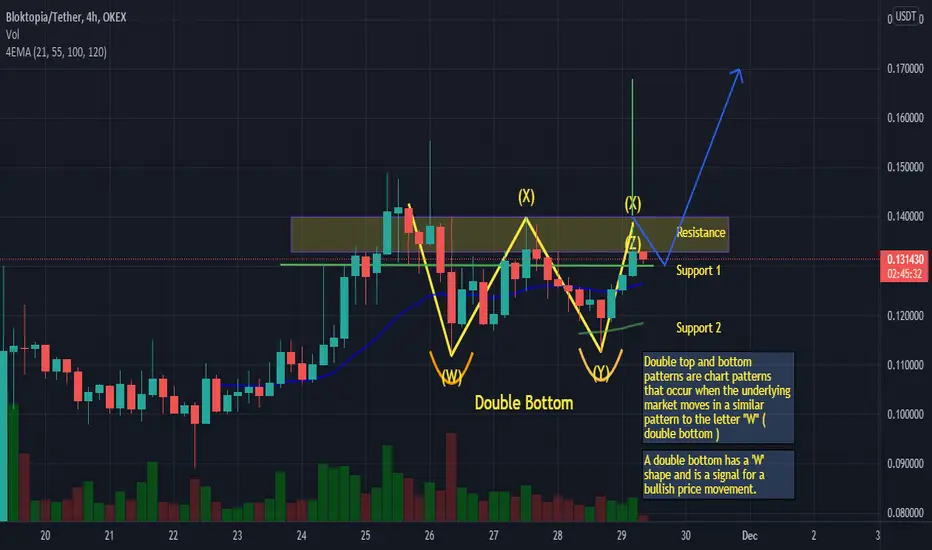
Double top and bottom patterns are chart patterns that occur when the underlying market moves in a similar pattern to the letter "W" ( double bottom )
A double bottom has a 'W' shape and is a signal for a bullish price movement.
If BLOK breaks R1 Region 0.13000-0.14000
Then
it can go to 0.17000-0.20000
A double bottom has a 'W' shape and is a signal for a bullish price movement.
If BLOK breaks R1 Region 0.13000-0.14000
Then
it can go to 0.17000-0.20000

כתב ויתור
המידע והפרסומים אינם מיועדים להיות, ואינם מהווים, ייעוץ או המלצה פיננסית, השקעתית, מסחרית או מכל סוג אחר המסופקת או מאושרת על ידי TradingView. קרא עוד ב־תנאי השימוש.
כתב ויתור
המידע והפרסומים אינם מיועדים להיות, ואינם מהווים, ייעוץ או המלצה פיננסית, השקעתית, מסחרית או מכל סוג אחר המסופקת או מאושרת על ידי TradingView. קרא עוד ב־תנאי השימוש.