
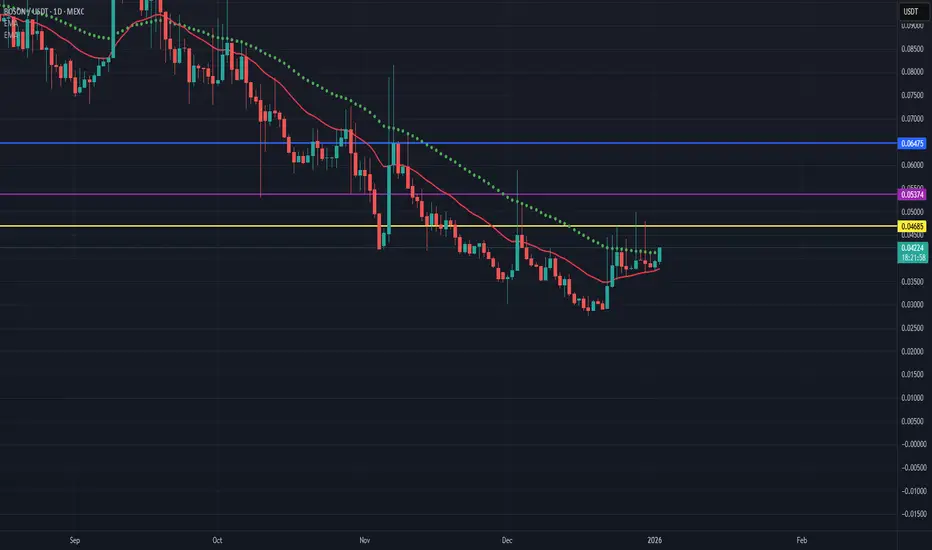
The chart shows an inverse head and shoulders pattern, but the formation condition is to look for closing prices above the yellow line. If this condition is met, the first target is 0.05374, which corresponds to the Fibonacci 1.414 level of the breakout. If we see closing prices above this level, the main target is 0.06475.

כתב ויתור
המידע והפרסומים אינם מיועדים להיות, ואינם מהווים, ייעוץ או המלצה פיננסית, השקעתית, מסחרית או מכל סוג אחר המסופקת או מאושרת על ידי TradingView. קרא עוד ב־תנאי השימוש.
כתב ויתור
המידע והפרסומים אינם מיועדים להיות, ואינם מהווים, ייעוץ או המלצה פיננסית, השקעתית, מסחרית או מכל סוג אחר המסופקת או מאושרת על ידי TradingView. קרא עוד ב־תנאי השימוש.