
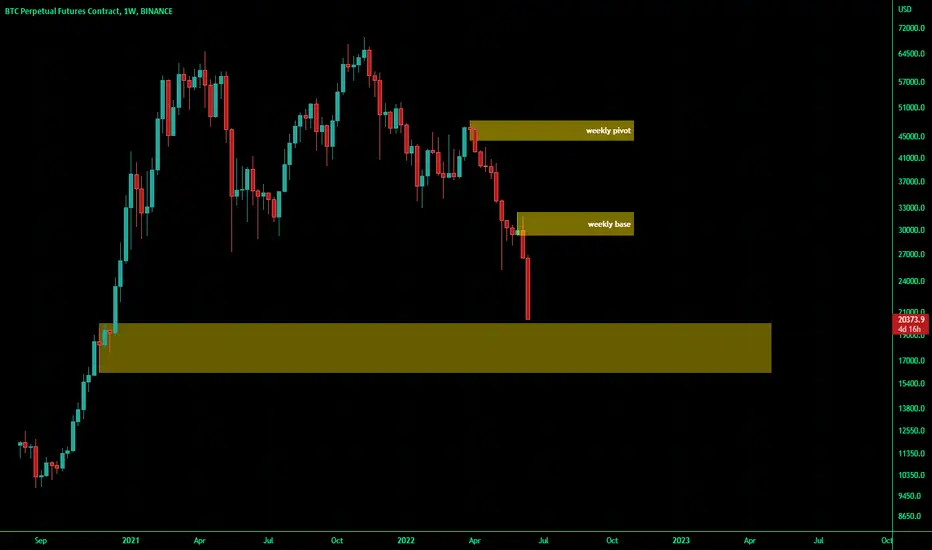
from supply and demand analysis point of view,
the areas that can clearly be seen on the chart are these yellow rectangles the analysis is like having the price stop running down on the lowest area and start an upward to the first green candle and the price will be in a trading range for while (1 year or 2 maybe )
the areas that can clearly be seen on the chart are these yellow rectangles the analysis is like having the price stop running down on the lowest area and start an upward to the first green candle and the price will be in a trading range for while (1 year or 2 maybe )

כתב ויתור
המידע והפרסומים אינם מיועדים להיות, ואינם מהווים, ייעוץ או המלצה פיננסית, השקעתית, מסחרית או מכל סוג אחר המסופקת או מאושרת על ידי TradingView. קרא עוד ב־תנאי השימוש.
כתב ויתור
המידע והפרסומים אינם מיועדים להיות, ואינם מהווים, ייעוץ או המלצה פיננסית, השקעתית, מסחרית או מכל סוג אחר המסופקת או מאושרת על ידי TradingView. קרא עוד ב־תנאי השימוש.