
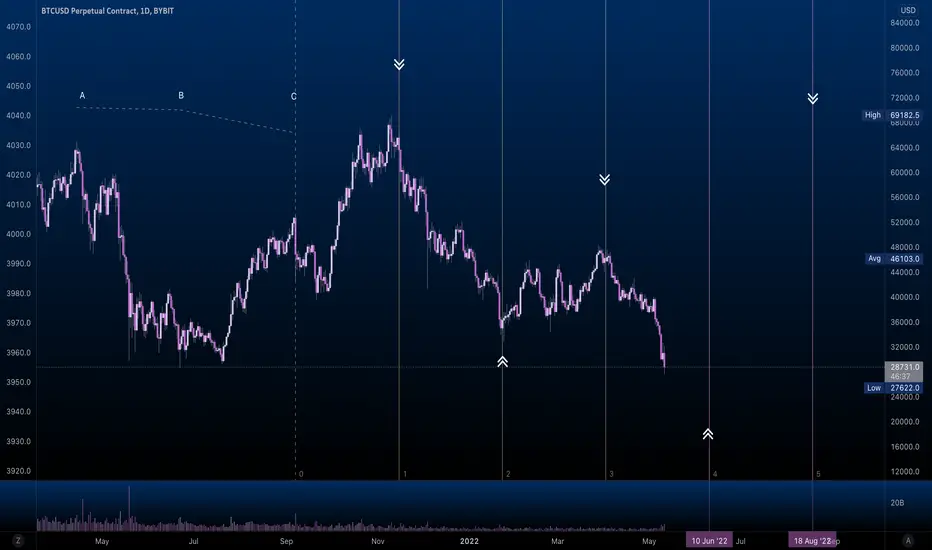
Take the April high, June low and extend from Sept high. Use 1:1 time ratios of A->B. Pretty much times every major pivot. To take this further and get a more accurate answer, use older pivots on another chart perhaps. I noticed that using negative 1:1 values also showed confluence, however it's slightly off.

כתב ויתור
המידע והפרסומים אינם מיועדים להיות, ואינם מהווים, ייעוץ או המלצה פיננסית, השקעתית, מסחרית או מכל סוג אחר המסופקת או מאושרת על ידי TradingView. קרא עוד ב־תנאי השימוש.
כתב ויתור
המידע והפרסומים אינם מיועדים להיות, ואינם מהווים, ייעוץ או המלצה פיננסית, השקעתית, מסחרית או מכל סוג אחר המסופקת או מאושרת על ידי TradingView. קרא עוד ב־תנאי השימוש.