
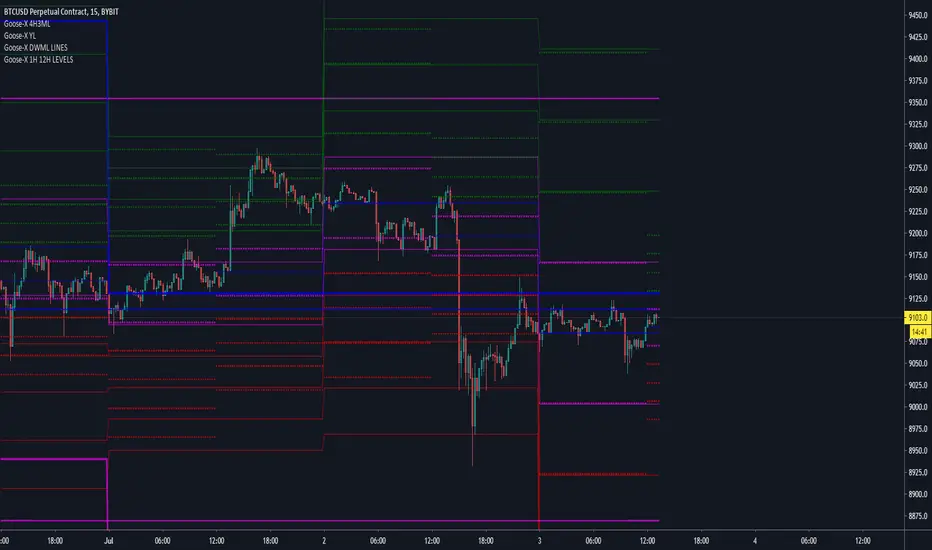
Chart containing all GX levels ( support/resistance ) of various periods: 1hr, 4hr, 12hr, 1day, 1week, 1month, 3months, 1year.
These are the most important and pre-fixed support/resist zones already written at every 00:00 UTC of the used period.
For example yearly levels are written there since 1° Jan 2020 00:00 UTC
These are the most important and pre-fixed support/resist zones already written at every 00:00 UTC of the used period.
For example yearly levels are written there since 1° Jan 2020 00:00 UTC

כתב ויתור
המידע והפרסומים אינם מיועדים להיות, ואינם מהווים, ייעוץ או המלצה פיננסית, השקעתית, מסחרית או מכל סוג אחר המסופקת או מאושרת על ידי TradingView. קרא עוד ב־תנאי השימוש.
כתב ויתור
המידע והפרסומים אינם מיועדים להיות, ואינם מהווים, ייעוץ או המלצה פיננסית, השקעתית, מסחרית או מכל סוג אחר המסופקת או מאושרת על ידי TradingView. קרא עוד ב־תנאי השימוש.