
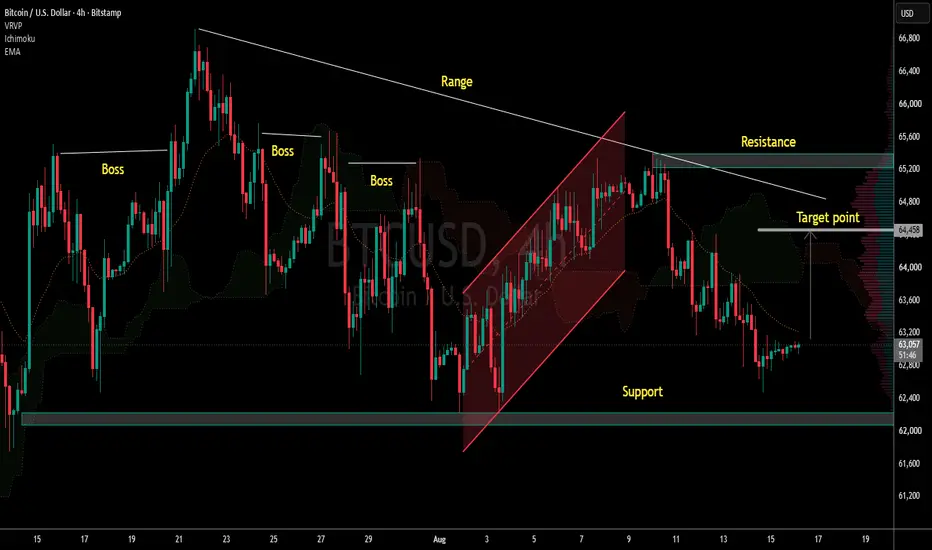
This is the Bitcoin / U.S. Dollar - BTCUSD 4-Hour chart on Bitstamp with manual levels marked.
Chart Analysis:
1. Range + Descending Trend: BTC has been trading in a big range. A descending "Range" trendline is coming down from the ∼$66,400 highs.
2. Failed Breakout: Price made a pink rising channel, broke up to test "Resistance" near $65,200, then got rejected hard.
3. Current Price: Now trading at ∼$62,600 - right above the major "Support" zone at $62,000 - $62,200. That's a key area marked on chart.
4. Structure: Multiple "Boss" supply zones were marked earlier. We failed at resistance and now in a pullback. "Target point" is marked around $64,000 if it bounces.
Key Levels to Watch:
- Resistance: $64,800 - $65,200 - Recent high + descending trendline. Break above needed for bullish continuation
- Support 1: $62,000 - $62,200 - Major horizontal support. Must hold for bulls
- Support 2: $61,000 - If $62K breaks, next downside target
Bias: Short-term bearish pressure while below $65,200. Holding $62,000 keeps the range alive. Losing $62,000 on 4H close likely sends BTC to test $61,000. Bounce from here could target the "Target point" at ∼$64,000.
Educational only. Not financial advice. Always manage risk
Chart Analysis:
1. Range + Descending Trend: BTC has been trading in a big range. A descending "Range" trendline is coming down from the ∼$66,400 highs.
2. Failed Breakout: Price made a pink rising channel, broke up to test "Resistance" near $65,200, then got rejected hard.
3. Current Price: Now trading at ∼$62,600 - right above the major "Support" zone at $62,000 - $62,200. That's a key area marked on chart.
4. Structure: Multiple "Boss" supply zones were marked earlier. We failed at resistance and now in a pullback. "Target point" is marked around $64,000 if it bounces.
Key Levels to Watch:
- Resistance: $64,800 - $65,200 - Recent high + descending trendline. Break above needed for bullish continuation
- Support 1: $62,000 - $62,200 - Major horizontal support. Must hold for bulls
- Support 2: $61,000 - If $62K breaks, next downside target
Bias: Short-term bearish pressure while below $65,200. Holding $62,000 keeps the range alive. Losing $62,000 on 4H close likely sends BTC to test $61,000. Bounce from here could target the "Target point" at ∼$64,000.
Educational only. Not financial advice. Always manage risk
עסקה פעילה
active
t.me/+iZwBzq15KTM1Mzc0
join telegram for free signal on gold and different markets
t.me/+iZwBzq15KTM1Mzc0
join free telegram channel
join telegram for free signal on gold and different markets
t.me/+iZwBzq15KTM1Mzc0
join free telegram channel
פרסומים קשורים
כתב ויתור
המידע והפרסומים אינם מיועדים להיות, ואינם מהווים, ייעוץ או המלצה פיננסית, השקעתית, מסחרית או מכל סוג אחר המסופקת או מאושרת על ידי TradingView. קרא עוד ב־תנאי השימוש.
t.me/+iZwBzq15KTM1Mzc0
join telegram for free signal on gold and different markets
t.me/+iZwBzq15KTM1Mzc0
join free telegram channel
join telegram for free signal on gold and different markets
t.me/+iZwBzq15KTM1Mzc0
join free telegram channel
פרסומים קשורים
כתב ויתור
המידע והפרסומים אינם מיועדים להיות, ואינם מהווים, ייעוץ או המלצה פיננסית, השקעתית, מסחרית או מכל סוג אחר המסופקת או מאושרת על ידי TradingView. קרא עוד ב־תנאי השימוש.