Bitcoin ( BTC) Daily: LTB Rejection & 17-EMA Loss Accelerate Downside Extension Toward 58,231 Support Base
### ₿ Bitcoin / U.S. Dollar (BTCUSD) Daily Technical Matrix (Ref: BTCUSD_2026-08-14_09-10-10.png)
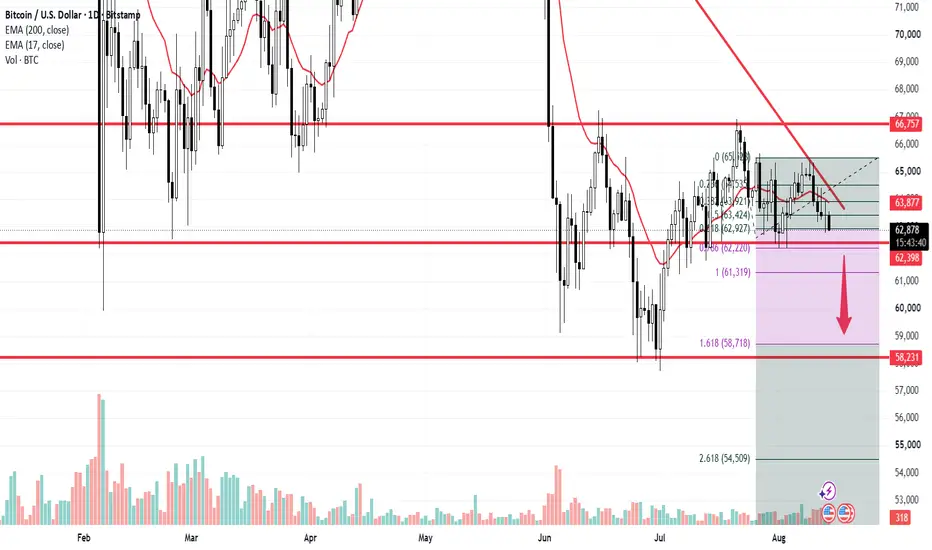
We are issuing an updated Daily (1D) structural study on Bitcoin (BTCUSD / BTC). Following the severe buy-side volume exhaustion noted beneath macro resistance, price action has confirmed a bearish rejection off the primary descending trendline (red LTB) and lost its short-term dynamic moving average floor.
Bitcoin is currently under sell-side pressure, trading down **-0.86% (-547 pts)** at **62,871**, breaking below local Fibonacci retracement support.
---
### 🔍 Technical Architecture & Downside Extension Vector:
Our quantitative setup isolates key Fibonacci expansion nodes driving the ongoing sell-off:
1. **Breakdown Mechanics (LTB Rejection & 17-EMA Loss):** The failure to generate buy-side volume at overhead supply led to a clean rejection from the red LTB and a breakdown below the **17-period EMA (red line at 63,877)**, turning it into dynamic overhead resistance.
2. **Fibonacci Extension Targets (Red Arrow Vector):** As price action loses the **0.618 Golden Ratio (62,927)**, momentum points to an extended downside expansion leg toward lower structural nodes:
* **Immediate Resistance Ceiling (17-EMA):** **63,877**
* **Intermediate Support Floor (0.786 Fibo):** **62,220**
* **1.0 Fibonacci Structural Anchor:** **61,319**
* **Primary Downside Target (1.618 Fibo Extension):** **58,718** — Confluent with the **58,231** macro horizontal support baseline.
* **Secondary Macro Target (2.618 Fibo Extension):** **54,509**
---
### 🛡️ Strategic Operational Scenarios:
* **Scenario A — Downside Extension to Macro Support (Red Arrow):** Continued sell-side dominance below the **63,877** EMA ceiling will push price action down through **61,319** toward the **58,718 (1.618 Fibo)** and **58,231** demand node, where major buyers are expected to defend the floor.
* **Scenario B — Bullish Reclaim & Fakeout Invalidation:** A swift daily reclaim back above the **17-EMA (63,877)** invalidates the immediate breakdown vector, allowingBTC to re-enter a neutral consolidation phase under the **66,757** horizontal ceiling.
### 📊 Tactical Parameters Summary:
* **Current Bias:** Short-Term Bearish / Breakdown Extension
* **Immediate Dynamic Resistance (17-EMA):** 63,877
* **Major Horizontal Resistance Ceiling:** 66,757
* **Intermediate Support Floor:** 62,220 / 61,319
* **Primary Downside Target Node (1.618 Fibo / Base Floor):** 58,718 – 58,231
* **Institutional Ceiling (200-EMA):** 71,835
---
📊 **ChartPro Data**
*Digital Asset Architecture, Fibonacci Extensions & Systematic Risk Management.*
⚠️ **Disclaimer:** For educational and informational purposes only. This active market study represents a personal trading framework and does not constitute financial or investment advice.
BTC) Daily: LTB Rejection & 17-EMA Loss Accelerate Downside Extension Toward 58,231 Support Base### ₿ Bitcoin / U.S. Dollar (
BTCUSD) Daily Technical Matrix (Ref: BTCUSD_2026-08-14_09-10-10.png)We are issuing an updated Daily (1D) structural study on Bitcoin (
BTCUSD / BTC). Following the severe buy-side volume exhaustion noted beneath macro resistance, price action has confirmed a bearish rejection off the primary descending trendline (red LTB) and lost its short-term dynamic moving average floor.Bitcoin is currently under sell-side pressure, trading down **-0.86% (-547 pts)** at **62,871**, breaking below local Fibonacci retracement support.
---
### 🔍 Technical Architecture & Downside Extension Vector:
Our quantitative setup isolates key Fibonacci expansion nodes driving the ongoing sell-off:
1. **Breakdown Mechanics (LTB Rejection & 17-EMA Loss):** The failure to generate buy-side volume at overhead supply led to a clean rejection from the red LTB and a breakdown below the **17-period EMA (red line at 63,877)**, turning it into dynamic overhead resistance.
2. **Fibonacci Extension Targets (Red Arrow Vector):** As price action loses the **0.618 Golden Ratio (62,927)**, momentum points to an extended downside expansion leg toward lower structural nodes:
* **Immediate Resistance Ceiling (17-EMA):** **63,877**
* **Intermediate Support Floor (0.786 Fibo):** **62,220**
* **1.0 Fibonacci Structural Anchor:** **61,319**
* **Primary Downside Target (1.618 Fibo Extension):** **58,718** — Confluent with the **58,231** macro horizontal support baseline.
* **Secondary Macro Target (2.618 Fibo Extension):** **54,509**
---
### 🛡️ Strategic Operational Scenarios:
* **Scenario A — Downside Extension to Macro Support (Red Arrow):** Continued sell-side dominance below the **63,877** EMA ceiling will push price action down through **61,319** toward the **58,718 (1.618 Fibo)** and **58,231** demand node, where major buyers are expected to defend the floor.
* **Scenario B — Bullish Reclaim & Fakeout Invalidation:** A swift daily reclaim back above the **17-EMA (63,877)** invalidates the immediate breakdown vector, allowing
BTC to re-enter a neutral consolidation phase under the **66,757** horizontal ceiling.### 📊 Tactical Parameters Summary:
* **Current Bias:** Short-Term Bearish / Breakdown Extension
* **Immediate Dynamic Resistance (17-EMA):** 63,877
* **Major Horizontal Resistance Ceiling:** 66,757
* **Intermediate Support Floor:** 62,220 / 61,319
* **Primary Downside Target Node (1.618 Fibo / Base Floor):** 58,718 – 58,231
* **Institutional Ceiling (200-EMA):** 71,835
---
📊 **ChartPro Data**
*Digital Asset Architecture, Fibonacci Extensions & Systematic Risk Management.*
⚠️ **Disclaimer:** For educational and informational purposes only. This active market study represents a personal trading framework and does not constitute financial or investment advice.

כתב ויתור
המידע והפרסומים אינם מיועדים להיות, ואינם מהווים, ייעוץ או המלצה פיננסית, השקעתית, מסחרית או מכל סוג אחר המסופקת או מאושרת על ידי TradingView. קרא עוד ב־תנאי השימוש.
כתב ויתור
המידע והפרסומים אינם מיועדים להיות, ואינם מהווים, ייעוץ או המלצה פיננסית, השקעתית, מסחרית או מכל סוג אחר המסופקת או מאושרת על ידי TradingView. קרא עוד ב־תנאי השימוש.