
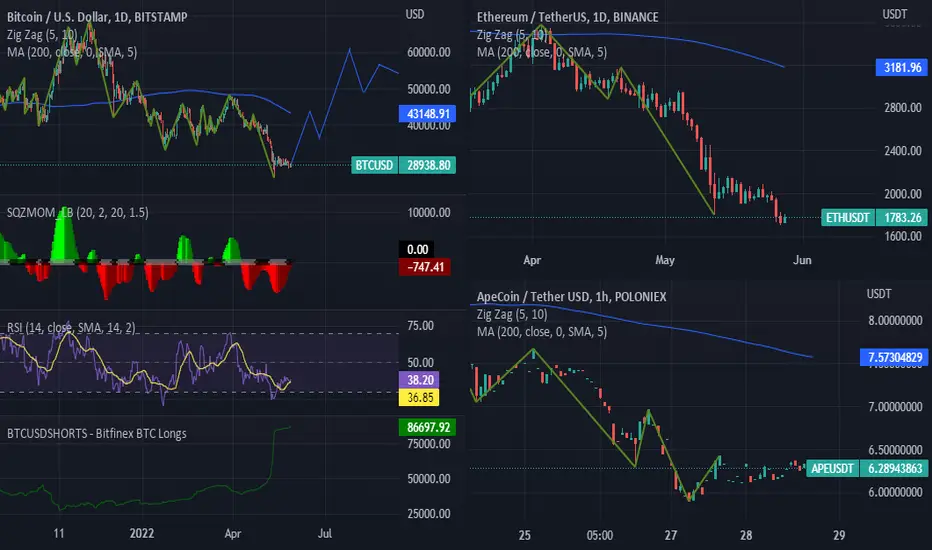
Ethereum and Bitcoin have both hit the lower end of the RSI Indicator. 8 weeks of red and frustration from recent events have created a situation where the new bull market could result in a possible new high. Most interestingly is the Weekly (14) RSI is at a history low indicating the market has exhausted its selling pressure. Targeting 63 RSI on the daily BITCOIN CHART followed by a correction before rocketing the Daily 73-77RSI range.

כתב ויתור
המידע והפרסומים אינם מיועדים להיות, ואינם מהווים, ייעוץ או המלצה פיננסית, השקעתית, מסחרית או מכל סוג אחר המסופקת או מאושרת על ידי TradingView. קרא עוד ב־תנאי השימוש.
כתב ויתור
המידע והפרסומים אינם מיועדים להיות, ואינם מהווים, ייעוץ או המלצה פיננסית, השקעתית, מסחרית או מכל סוג אחר המסופקת או מאושרת על ידי TradingView. קרא עוד ב־תנאי השימוש.