
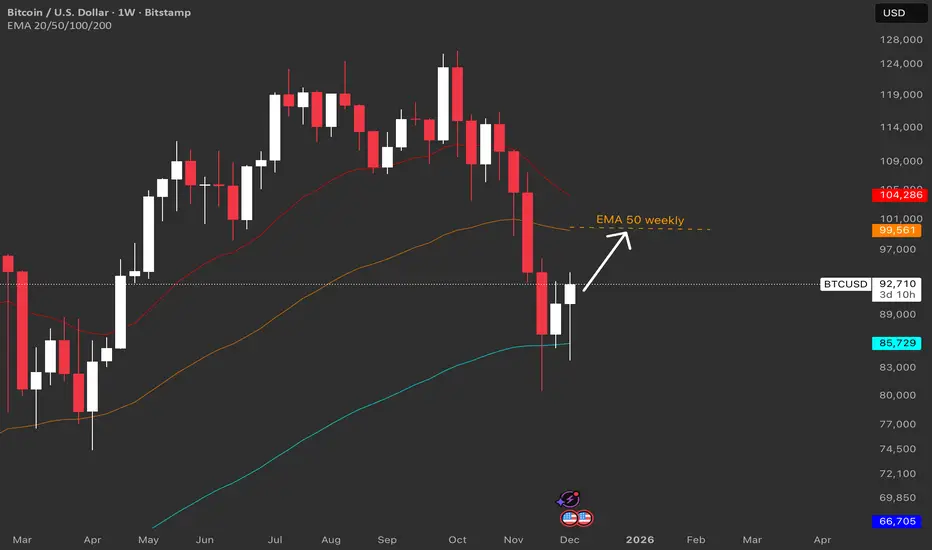
🎯 Why the EMA 50 Matters
The 50-week moving average is a simple trend line that traders watch:
✅ Trend signal – If price stays above it, the trend is up. Below it, the trend is down.
✅ Support/Resistance – It acts like a magnet that price bounces off.
✅ Everyone watches it – When many traders use the same level, it becomes real support.
📈 Scenario 1: REJECT (Price Goes Down)
Bitcoin bounces down from the EMA 50
Price falls back to ~$85–92K
Trend weakens temporarily
What to look for:
Weekly close below $99,553
Lower highs on daily chart
Selling pressure increases
📉 Scenario 2: BREAK (Price Goes Up)
Bitcoin closes above EMA 50 with strength
Price continues toward $120–128K
Trend stays strong
What to look for:
Weekly close above $99,553
Strong volume on the push up
Higher lows forming
🔮 Most Likely Outcome: DOWN FIRST, THEN UP
Probability:
Reject now: ext 1–2 weeks
Eventually breaks higher: ~70% (next 1–2 months)
📌 Simple Trade Plan
If you're bullish:
Buy dips near $85–87K (the blue line)
Stop loss below $83K
Target $120K+
The 50-week moving average is a simple trend line that traders watch:
✅ Trend signal – If price stays above it, the trend is up. Below it, the trend is down.
✅ Support/Resistance – It acts like a magnet that price bounces off.
✅ Everyone watches it – When many traders use the same level, it becomes real support.
📈 Scenario 1: REJECT (Price Goes Down)
Bitcoin bounces down from the EMA 50
Price falls back to ~$85–92K
Trend weakens temporarily
What to look for:
Weekly close below $99,553
Lower highs on daily chart
Selling pressure increases
📉 Scenario 2: BREAK (Price Goes Up)
Bitcoin closes above EMA 50 with strength
Price continues toward $120–128K
Trend stays strong
What to look for:
Weekly close above $99,553
Strong volume on the push up
Higher lows forming
🔮 Most Likely Outcome: DOWN FIRST, THEN UP
Probability:
Reject now: ext 1–2 weeks
Eventually breaks higher: ~70% (next 1–2 months)
📌 Simple Trade Plan
If you're bullish:
Buy dips near $85–87K (the blue line)
Stop loss below $83K
Target $120K+

כתב ויתור
המידע והפרסומים אינם מיועדים להיות, ואינם מהווים, ייעוץ או המלצה פיננסית, השקעתית, מסחרית או מכל סוג אחר המסופקת או מאושרת על ידי TradingView. קרא עוד ב־תנאי השימוש.
כתב ויתור
המידע והפרסומים אינם מיועדים להיות, ואינם מהווים, ייעוץ או המלצה פיננסית, השקעתית, מסחרית או מכל סוג אחר המסופקת או מאושרת על ידי TradingView. קרא עוד ב־תנאי השימוש.