
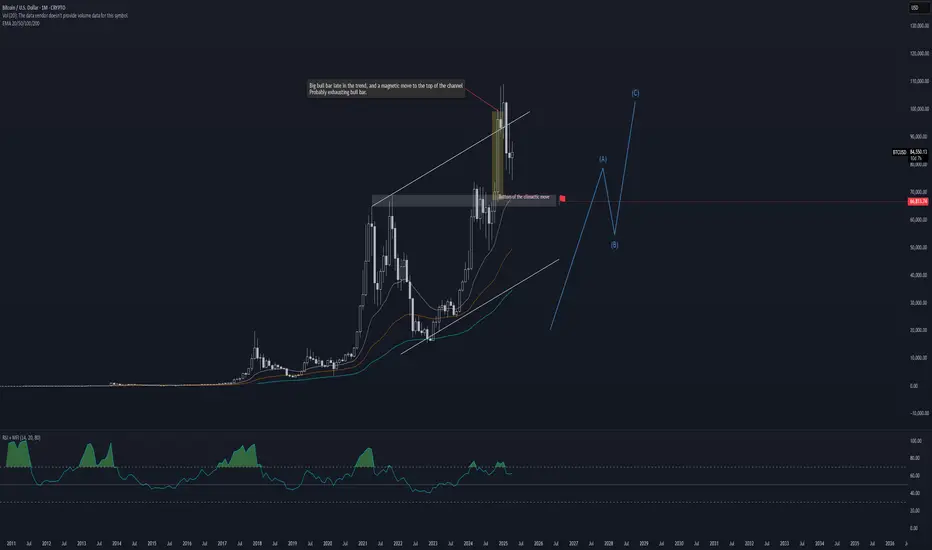
Here is the monthly chart of the bitcoin. Based on price action analysis, we have a broad bull channel. We can see 2 price action signs here:
1- Second leg in the bull channel, we call it second leg trap
2- A climactic move to the top of the channel (biggest bull bar late in the trend)
Given the context, there is 60% chance that we see the bottom of the climactic move, which is $67,000.
The pessimistic perspective is that the bitcoin may see and test the bottom of the channel, around $50k.
1- Second leg in the bull channel, we call it second leg trap
2- A climactic move to the top of the channel (biggest bull bar late in the trend)
Given the context, there is 60% chance that we see the bottom of the climactic move, which is $67,000.
The pessimistic perspective is that the bitcoin may see and test the bottom of the channel, around $50k.

כתב ויתור
המידע והפרסומים אינם מיועדים להיות, ואינם מהווים, ייעוץ או המלצה פיננסית, השקעתית, מסחרית או מכל סוג אחר המסופקת או מאושרת על ידי TradingView. קרא עוד ב־תנאי השימוש.
כתב ויתור
המידע והפרסומים אינם מיועדים להיות, ואינם מהווים, ייעוץ או המלצה פיננסית, השקעתית, מסחרית או מכל סוג אחר המסופקת או מאושרת על ידי TradingView. קרא עוד ב־תנאי השימוש.