
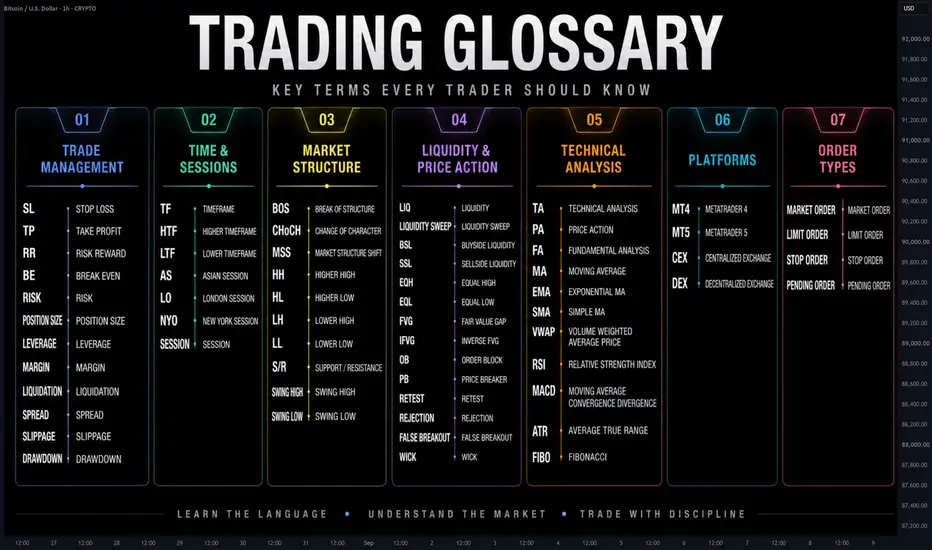
The Trading Glossary Every Beginner Trader Should KnowWhen you start trading, the hardest part is not always reading the chart.
Sometimes, it is simply understanding the language traders use.
You will see terms like SL, TP, BOS, FVG, OB, Liquidity, Pullback, RR, TF and many others everywhere.
This guide is designed as a simple reference for beginners — from basic trade management to technical analysis and market structure.
Save it. You will probably need it again.


01 — TRADE MANAGEMENT
SL — Stop Loss
TP — Take Profit
Entry
BE — Break Even
RR / R:R — Risk-to-Reward Ratio
The Risk-to-Reward Ratio compares the amount you are risking with the potential reward.
RISK — Risk
Leverage
Margin
Liquidation
Spread
Slippage
Slippage occurs when your order is executed at a different price than expected.
It can become more significant during high volatility or low liquidity.
Drawdown
TF — Time Frame
A Time Frame determines how much time each candle represents.
Examples:
HTF — Higher Time Frame
LTF — Lower Time Frame
Session
BOS — Break of Structure
Break of Structure occurs when price breaks an important previous swing point.
It can provide information about a potential continuation or change in market structure.
CHoCH — Change of Character
MSS — Market Structure Shift
HH — Higher High
A Higher High is a swing high that forms above the previous significant swing high.
HL — Higher Low
A Higher Low is a swing low that forms above the previous significant swing low.
A sequence of HH + HL generally describes bullish structure.
LH — Lower High
A Lower High forms below the previous significant swing high.
LL — Lower Low
A Lower Low forms below the previous significant swing low.
A sequence of LH + LL generally describes bearish structure.
S/R — Support & Resistance
Support is an area where buying interest has previously appeared.
Resistance is an area where selling pressure has previously appeared.
These are usually better treated as zones, not perfectly precise lines.
Swing High
A Swing High is a local price high formed between lower highs around it.
Swing Low
A Swing Low is a local price low formed between higher lows around it.
LIQ — Liquidity
Liquidity refers to available buying and selling interest in the market.
In technical trading, traders often watch areas where many Stop Losses or pending orders may be concentrated.
Liquidity Sweep
Stop Hunt
BSL — Buy-Side Liquidity
Buy-Side Liquidity generally refers to liquidity resting above important highs.
SSL — Sell-Side Liquidity
Sell-Side Liquidity generally refers to liquidity resting below important lows.
EQH — Equal Highs
Two or more highs forming around a similar price level.
Traders often watch the area above them for potential buy-side liquidity.
EQL — Equal Lows
Two or more lows forming around a similar price level.
The area below them may contain potential sell-side liquidity.
Wick
Rejection
False Breakout
PB — Pullback
A Pullback is a temporary move against the current directional movement.
For example:
Bullish move → Pullback → Potential continuation
A pullback is not automatically a reversal.
Retest
A Retest occurs when price returns to a previously broken level or structure to test it again.
FVG — Fair Value Gap
IFVG — Inverse Fair Value Gap
OB — Order Block
Breaker Block
Mitigation
Premium
Discount
TA — Technical Analysis
Technical Analysis is the study of price, volume, structure and market behavior using charts and technical tools.
FA — Fundamental Analysis
Fundamental Analysis evaluates the underlying economic, financial or business factors that may influence an asset's value.
PA — Price Action
Price Action is the analysis of market behavior directly from price movement, candles and structure.
MA — Moving Average
A Moving Average smooths price data to help traders identify trends and market direction.
EMA — Exponential Moving Average
An EMA gives greater weight to more recent prices than a simple moving average.
SMA — Simple Moving Average
RSI — Relative Strength Index
FIBO — Fibonacci
Fibonacci Retracement and Fibonacci Extension tools are used to identify potential retracement and projection levels based on mathematical ratios.
MT4 — MetaTrader 4
MetaTrader 4 is a trading platform widely used for Forex and CFD trading.
MT5 — MetaTrader 5
MetaTrader 5 is the newer MetaTrader platform, supporting multiple asset classes and advanced trading functionality.
CEX — Centralized Exchange
A Centralized Exchange is a trading platform operated by a centralized company.
DEX — Decentralized Exchange
A Decentralized Exchange allows users to trade through blockchain-based protocols rather than relying entirely on a centralized intermediary.
Market Order
An order designed to execute immediately at the best available price.
Limit Order
An order placed at a specified price or better.
It allows traders to wait for price to reach their desired level rather than entering immediately.
Stop Order
An order that becomes active when price reaches a predefined trigger level.
Pending Order
Risk Warning
This content is for educational purposes only and should not be considered financial or investment advice. Trading financial markets, particularly with leverage, involves substantial risk. Always understand the instrument you are trading and define your risk before entering a position.
Sometimes, it is simply understanding the language traders use.
You will see terms like SL, TP, BOS, FVG, OB, Liquidity, Pullback, RR, TF and many others everywhere.
This guide is designed as a simple reference for beginners — from basic trade management to technical analysis and market structure.
Save it. You will probably need it again.
01 — TRADE MANAGEMENT
SL — Stop Loss
A Stop Loss is an order used to automatically close a trade at a predefined price if the market moves against you.
Its primary purpose is to limit potential loss.
You can place it with your broker or exchange, so the position can be closed even when you are not watching the market.
A Stop Loss does not guarantee the exact execution price during extreme volatility or gaps.
TP — Take Profit
Take Profit is an order used to automatically close a trade when price reaches a predefined profit target.
Traders can use multiple targets, such as:
TP1 → TP2 → TP3
This allows part of a position to be closed while the remaining position stays open.
Entry
The Entry is the price or area where you plan to open a trade.
An entry can be based on a specific price, a zone, or confirmation from price action.
BE — Break Even
Break Even means moving the Stop Loss to the entry price.
If price reaches the entry again, the trade may close around zero profit or loss, excluding fees and execution costs.
RR / R:R — Risk-to-Reward Ratio
The Risk-to-Reward Ratio compares the amount you are risking with the potential reward.
- For example:
- Risk = $100
- Potential Reward = $300
- That is approximately:
- 1:3 RR
- RR does not predict whether a trade will win. It simply describes the relationship between potential risk and potential reward.
RISK — Risk
Risk is the amount of capital you are willing to lose if your trade reaches its invalidation or Stop Loss.
Professional traders define risk before entering the trade.
Position Size
Position size is the amount of an asset you trade.
It should be calculated based on your account size, risk percentage, entry price and Stop Loss distance.
Leverage
Leverage allows traders to control a larger position with less initial capital.
It can increase potential returns, but it also increases the speed and magnitude of potential losses.
Leverage does not make a trade safer.
Margin
Margin is the capital required to open and maintain a leveraged position.
If available margin becomes insufficient, a position may be liquidated.
Liquidation
Liquidation occurs when an exchange automatically closes a leveraged position because the trader no longer has enough margin to maintain it.
Spread
The Spread is the difference between the Bid and Ask price.
A wider spread increases the cost of entering and exiting a trade.
Slippage
Slippage occurs when your order is executed at a different price than expected.
It can become more significant during high volatility or low liquidity.
Drawdown
Drawdown measures the decline in an account from a previous equity high to a subsequent low.
It is an important measurement of trading risk and performance.
- 02 — TIME & MARKET SESSIONS
TF — Time Frame
A Time Frame determines how much time each candle represents.
Examples:
- 1M → 1 minute
- 5M → 5 minutes
- 15M → 15 minutes
- 1H → 1 hour
- 4H → 4 hours
- 1D → Daily
- 1W → Weekly
HTF — Higher Time Frame
A Higher Time Frame is a larger chart interval used to understand the broader market structure.
Examples:
4H, Daily, Weekly
LTF — Lower Time Frame
A Lower Time Frame provides more detailed price action.
Examples:
1M, 5M, 15M
- Traders often use HTF for context and LTF for execution.
AS — Asian Session
The Asian Session is one of the major global trading sessions.
Market liquidity and volatility can differ significantly from the European and US sessions.
LO — London Open
London Open refers to the opening period of the London trading session.
It is often watched because liquidity and volatility can increase around this time.
NYO — New York Open
New York Open refers to the opening period of the New York trading session.
It is particularly important for Forex, Gold and US-related markets.
Session
A Trading Session refers to a specific period of market activity, such as Asia, London or New York.
Time does not tell you where price will go.
It helps you understand the environment in which price is moving.
- 03 — MARKET STRUCTURE
BOS — Break of Structure
Break of Structure occurs when price breaks an important previous swing point.
It can provide information about a potential continuation or change in market structure.
CHoCH — Change of Character
Change of Character describes a potential shift in market behavior or structure.
For example, a market that has been creating lower highs and lower lows may show a CHoCH when it breaks an important lower high.
MSS — Market Structure Shift
Market Structure Shift refers to a meaningful change in the sequence of highs and lows.
It is commonly used to identify a potential transition from bullish to bearish conditions, or vice versa.
HH — Higher High
A Higher High is a swing high that forms above the previous significant swing high.
HL — Higher Low
A Higher Low is a swing low that forms above the previous significant swing low.
A sequence of HH + HL generally describes bullish structure.
LH — Lower High
A Lower High forms below the previous significant swing high.
LL — Lower Low
A Lower Low forms below the previous significant swing low.
A sequence of LH + LL generally describes bearish structure.
S/R — Support & Resistance
Support is an area where buying interest has previously appeared.
Resistance is an area where selling pressure has previously appeared.
These are usually better treated as zones, not perfectly precise lines.
Swing High
A Swing High is a local price high formed between lower highs around it.
Swing Low
A Swing Low is a local price low formed between higher lows around it.
- 04 — LIQUIDITY & PRICE ACTION
LIQ — Liquidity
Liquidity refers to available buying and selling interest in the market.
In technical trading, traders often watch areas where many Stop Losses or pending orders may be concentrated.
Liquidity Sweep
A Liquidity Sweep occurs when price temporarily moves through an important high or low, triggering orders, and then reverses or returns back into the previous range.
Stop Hunt
A Stop Hunt is a commonly used term for a move through an obvious level that triggers clustered Stop Loss orders before price reverses.
It should not automatically be assumed that every wick is a Stop Hunt.
BSL — Buy-Side Liquidity
Buy-Side Liquidity generally refers to liquidity resting above important highs.
SSL — Sell-Side Liquidity
Sell-Side Liquidity generally refers to liquidity resting below important lows.
EQH — Equal Highs
Two or more highs forming around a similar price level.
Traders often watch the area above them for potential buy-side liquidity.
EQL — Equal Lows
Two or more lows forming around a similar price level.
The area below them may contain potential sell-side liquidity.
Wick
A Wick is the portion of a candlestick extending beyond the candle's body.
It represents prices that were reached but not maintained at the candle's close.
Rejection
A Rejection occurs when price reaches an area but fails to maintain acceptance there and moves away.
False Breakout
A False Breakout occurs when price breaks an important level but fails to continue and returns back through the level.
- 05 — ENTRY CONCEPTS
PB — Pullback
A Pullback is a temporary move against the current directional movement.
For example:
Bullish move → Pullback → Potential continuation
A pullback is not automatically a reversal.
Retest
A Retest occurs when price returns to a previously broken level or structure to test it again.
FVG — Fair Value Gap
A Fair Value Gap is an imbalance created by a strong price movement where trading activity leaves a relatively inefficient area between candles.
Traders may watch FVGs as potential reaction or retracement zones.
IFVG — Inverse Fair Value Gap
An Inverse Fair Value Gap refers to an FVG that has been violated and subsequently changes its potential role.
For example, an area that previously acted as support may later become resistance after a decisive break.
OB — Order Block
An Order Block is a price area that traders identify as the origin of a significant impulsive move.
Different trading methodologies define Order Blocks differently, so the term should not be treated as a universally standardized concept.
Breaker Block
A Breaker Block is generally an Order Block or structure zone that fails and later acts from the opposite side.
Mitigation
Mitigation generally describes price returning to a previously identified zone to rebalance or react before continuing.
Premium
In market-structure methodologies, the Premium area refers to the upper portion of a defined range.
Discount
The Discount area refers to the lower portion of a defined range.
Traders may use these concepts to evaluate whether price is relatively expensive or cheap within a specific range, not in absolute terms.
- 06 — TECHNICAL ANALYSIS
TA — Technical Analysis
Technical Analysis is the study of price, volume, structure and market behavior using charts and technical tools.
FA — Fundamental Analysis
Fundamental Analysis evaluates the underlying economic, financial or business factors that may influence an asset's value.
PA — Price Action
Price Action is the analysis of market behavior directly from price movement, candles and structure.
MA — Moving Average
A Moving Average smooths price data to help traders identify trends and market direction.
EMA — Exponential Moving Average
An EMA gives greater weight to more recent prices than a simple moving average.
SMA — Simple Moving Average
An SMA calculates the average price over a specified number of periods.
VWAP — Volume Weighted Average Price
VWAP calculates the average traded price weighted by volume.
It is widely used to evaluate the average price at which trading activity occurred during a specific period.
RSI — Relative Strength Index
RSI is a momentum indicator used to measure the strength and speed of price movements.
MACD — Moving Average Convergence Divergence
MACD is a momentum and trend-following indicator based on moving averages.
ATR — Average True Range
ATR measures market volatility.
It does not predict direction; it helps traders understand how much an asset is typically moving.
FIBO — Fibonacci
Fibonacci Retracement and Fibonacci Extension tools are used to identify potential retracement and projection levels based on mathematical ratios.
- Common levels include:
0.382
0.500
0.618
0.786
1.000
1.618
- 07 — TRADING PLATFORMS
MT4 — MetaTrader 4
MetaTrader 4 is a trading platform widely used for Forex and CFD trading.
MT5 — MetaTrader 5
MetaTrader 5 is the newer MetaTrader platform, supporting multiple asset classes and advanced trading functionality.
CEX — Centralized Exchange
A Centralized Exchange is a trading platform operated by a centralized company.
DEX — Decentralized Exchange
A Decentralized Exchange allows users to trade through blockchain-based protocols rather than relying entirely on a centralized intermediary.
- 08 — ORDER TYPES
Market Order
An order designed to execute immediately at the best available price.
Limit Order
An order placed at a specified price or better.
It allows traders to wait for price to reach their desired level rather than entering immediately.
Stop Order
An order that becomes active when price reaches a predefined trigger level.
Pending Order
A general term for an order waiting to be triggered in the future.
The Most Important Lesson
Learning these abbreviations is useful.
But knowing the vocabulary does not make someone a trader.
Understanding risk, market structure, execution, probability and psychology is far more important.
You don't need to trade every BOS.
You don't need to enter every FVG.
You don't need to chase every breakout.
And you certainly don't need to understand every indicator on TradingView.
The goal is not to find more reasons to trade.
The goal is to understand when there is a reason to trade — and when there isn't.
Save this glossary. Learn the language first. Then learn how to use it.
Risk Warning
This content is for educational purposes only and should not be considered financial or investment advice. Trading financial markets, particularly with leverage, involves substantial risk. Always understand the instrument you are trading and define your risk before entering a position.

✨ Learn • Analyze • Trade
📊 Free Analysis for Crypto • Forex • Gold
t.me/pullbacksignal
🎯 Price Action & Market Structure
📚 Trading Education & Market Insights
📊 Free Analysis for Crypto • Forex • Gold
t.me/pullbacksignal
🎯 Price Action & Market Structure
📚 Trading Education & Market Insights
פרסומים קשורים
כתב ויתור
המידע והפרסומים אינם מיועדים להיות, ואינם מהווים, ייעוץ או המלצה פיננסית, השקעתית, מסחרית או מכל סוג אחר המסופקת או מאושרת על ידי TradingView. קרא עוד ב־תנאי השימוש.
✨ Learn • Analyze • Trade
📊 Free Analysis for Crypto • Forex • Gold
t.me/pullbacksignal
🎯 Price Action & Market Structure
📚 Trading Education & Market Insights
📊 Free Analysis for Crypto • Forex • Gold
t.me/pullbacksignal
🎯 Price Action & Market Structure
📚 Trading Education & Market Insights
פרסומים קשורים
כתב ויתור
המידע והפרסומים אינם מיועדים להיות, ואינם מהווים, ייעוץ או המלצה פיננסית, השקעתית, מסחרית או מכל סוג אחר המסופקת או מאושרת על ידי TradingView. קרא עוד ב־תנאי השימוש.