
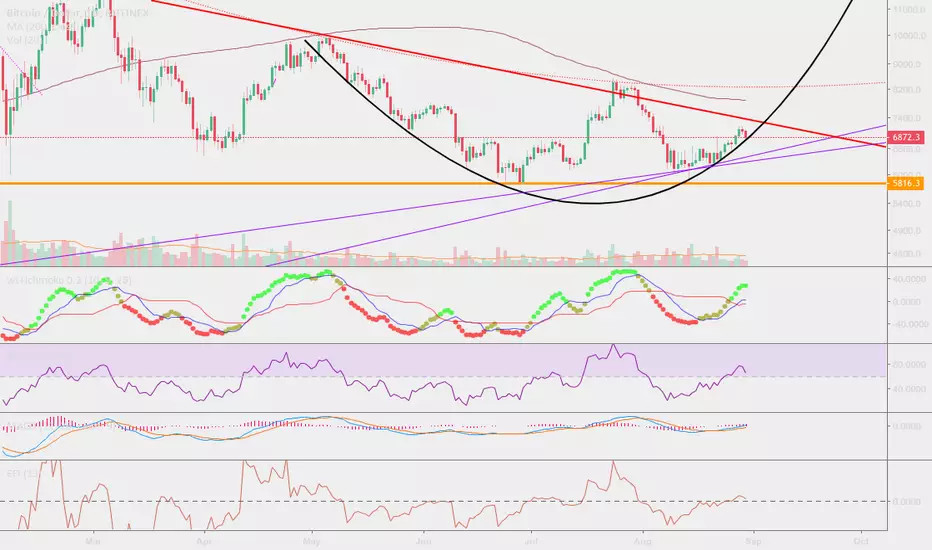
let see how this black curve acts as a support :)
If it breaks there are still my two major support lines in pink
First Higher low since April 18
On the daily chart
MACD looking still wide open
EFI still above 0
RSI above 50
On the weekly chart
overall increasing volume
we are extremely close for a cross in the MACD
RSI making the first higher low
EFI heading to 0 and getting close
I'm not an expert so don't follow my advice, these are just my observations but feel free to comment, good luck! :)
If it breaks there are still my two major support lines in pink
First Higher low since April 18
On the daily chart
MACD looking still wide open
EFI still above 0
RSI above 50
On the weekly chart
overall increasing volume
we are extremely close for a cross in the MACD
RSI making the first higher low
EFI heading to 0 and getting close
I'm not an expert so don't follow my advice, these are just my observations but feel free to comment, good luck! :)
הערה
Well we bounced right on the line and added more longs :)הערה
Check out how these two major support trend lines (in purple) have offered support since 2015. These two lines have been strong resistance/support lines in the past so I expect BTC to hold above it. The black arched line is the first support line which has worked well so far, if we break down from it, I expect we will test once more these two purple lines. This is quite likely to happen as there is a potential H&S forming which target are those two lines around 6700.
הערה
Potential H&S forming with $8500 target, this would send us back to the last lower high. I’m not sure of the validity of this H&S though, but if it happens it would be a good catalyst for the next run. That and the breakout. I will keep an eye on it. הערה
We seem to have completed this potential iH&S, target would be between $8000 and $8500 but I would love to see BTC set a new higher high around $9000 (unlikely). Before going to those levels I would like to see BTC test our two long term trend-lines.
כתב ויתור
המידע והפרסומים אינם מיועדים להיות, ואינם מהווים, ייעוץ או המלצה פיננסית, השקעתית, מסחרית או מכל סוג אחר המסופקת או מאושרת על ידי TradingView. קרא עוד ב־תנאי השימוש.
כתב ויתור
המידע והפרסומים אינם מיועדים להיות, ואינם מהווים, ייעוץ או המלצה פיננסית, השקעתית, מסחרית או מכל סוג אחר המסופקת או מאושרת על ידי TradingView. קרא עוד ב־תנאי השימוש.