
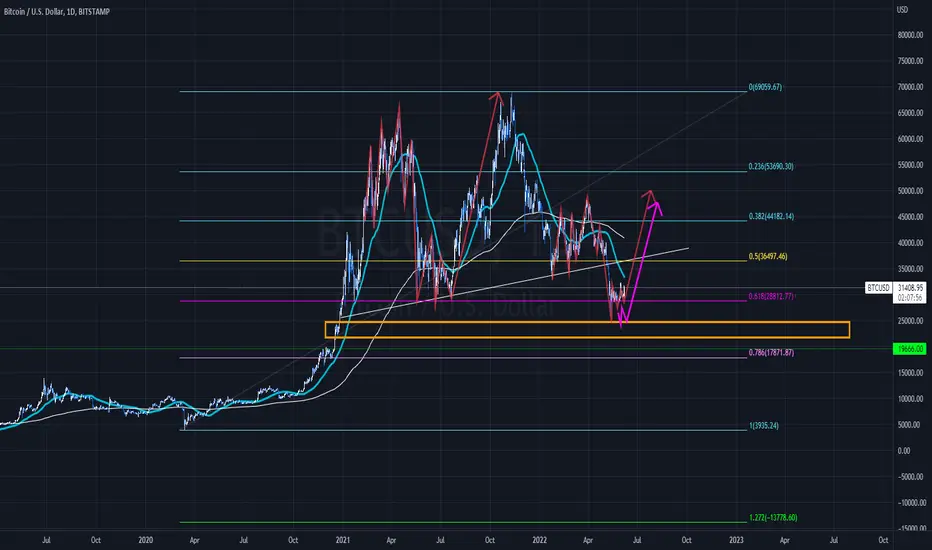
Drew this chart about 1.5 weeks ago. The idea was that we are in the same fractal as illustrated previous to the current one and we either bounce of the major 61.8 (red wave) the upwards or 20k retest then upwards (pink wave), or break below 20k and potentially begin a multi-year bear market.
Let's see.
Let's see.

כתב ויתור
המידע והפרסומים אינם מיועדים להיות, ואינם מהווים, ייעוץ או המלצה פיננסית, השקעתית, מסחרית או מכל סוג אחר המסופקת או מאושרת על ידי TradingView. קרא עוד ב־תנאי השימוש.
כתב ויתור
המידע והפרסומים אינם מיועדים להיות, ואינם מהווים, ייעוץ או המלצה פיננסית, השקעתית, מסחרית או מכל סוג אחר המסופקת או מאושרת על ידי TradingView. קרא עוד ב־תנאי השימוש.