
Market Structure & Analysis:
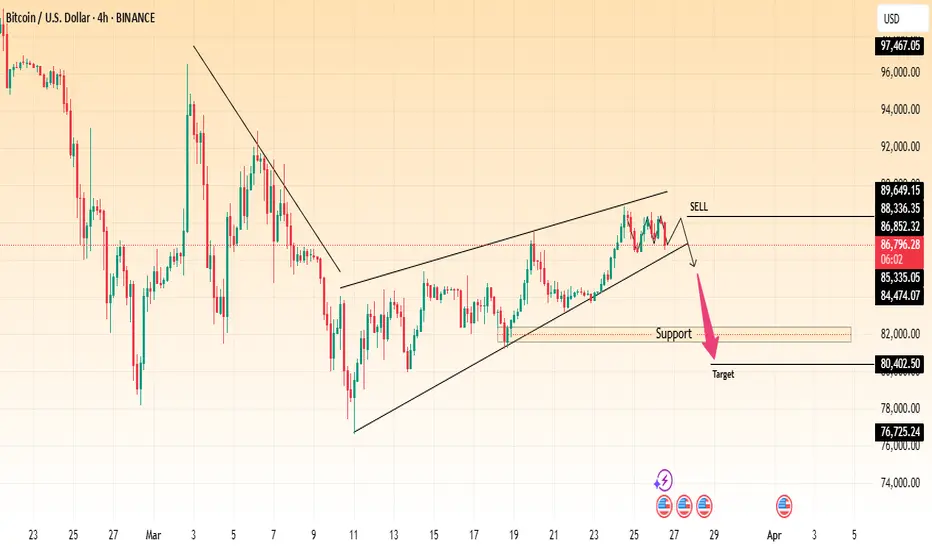
Rising Wedge Formation: Price has been moving within a rising wedge pattern, which is typically a bearish reversal pattern.
Bearish Breakdown Expected: BTC is testing the lower boundary of the wedge, indicating a potential breakdown.
Resistance Zone:
$89,649 – Key resistance level preventing further upside.
$88,336 – Local resistance that price failed to sustain above.
Support Levels:
$86,852 - $85,335 – Intermediate support range.
$80,402 – Main target for a bearish move.
$76,725 – Secondary support in case of further decline.
Trading Plan:
Sell Setup:
Wait for confirmation of a breakdown below the wedge.
Enter short if price closes below $86,852 with volume confirmation.
Stop Loss: Above $88,336 to avoid false breakouts.
Take Profit Targets:
TP1: $84,474 (first support level).
TP2: $80,402 (main target).
TP3: $76,725 (extended bearish target).
Risk Factors:
If BTC finds strong support at $86,852, a bounce could invalidate the bearish setup.
Macro events (ETF approvals, institutional buy-ins, Fed rate decisions) may impact price action.
Rising Wedge Formation: Price has been moving within a rising wedge pattern, which is typically a bearish reversal pattern.
Bearish Breakdown Expected: BTC is testing the lower boundary of the wedge, indicating a potential breakdown.
Resistance Zone:
$89,649 – Key resistance level preventing further upside.
$88,336 – Local resistance that price failed to sustain above.
Support Levels:
$86,852 - $85,335 – Intermediate support range.
$80,402 – Main target for a bearish move.
$76,725 – Secondary support in case of further decline.
Trading Plan:
Sell Setup:
Wait for confirmation of a breakdown below the wedge.
Enter short if price closes below $86,852 with volume confirmation.
Stop Loss: Above $88,336 to avoid false breakouts.
Take Profit Targets:
TP1: $84,474 (first support level).
TP2: $80,402 (main target).
TP3: $76,725 (extended bearish target).
Risk Factors:
If BTC finds strong support at $86,852, a bounce could invalidate the bearish setup.
Macro events (ETF approvals, institutional buy-ins, Fed rate decisions) may impact price action.

כתב ויתור
המידע והפרסומים אינם מיועדים להיות, ואינם מהווים, ייעוץ או המלצה פיננסית, השקעתית, מסחרית או מכל סוג אחר המסופקת או מאושרת על ידי TradingView. קרא עוד ב־תנאי השימוש.
כתב ויתור
המידע והפרסומים אינם מיועדים להיות, ואינם מהווים, ייעוץ או המלצה פיננסית, השקעתית, מסחרית או מכל סוג אחר המסופקת או מאושרת על ידי TradingView. קרא עוד ב־תנאי השימוש.