
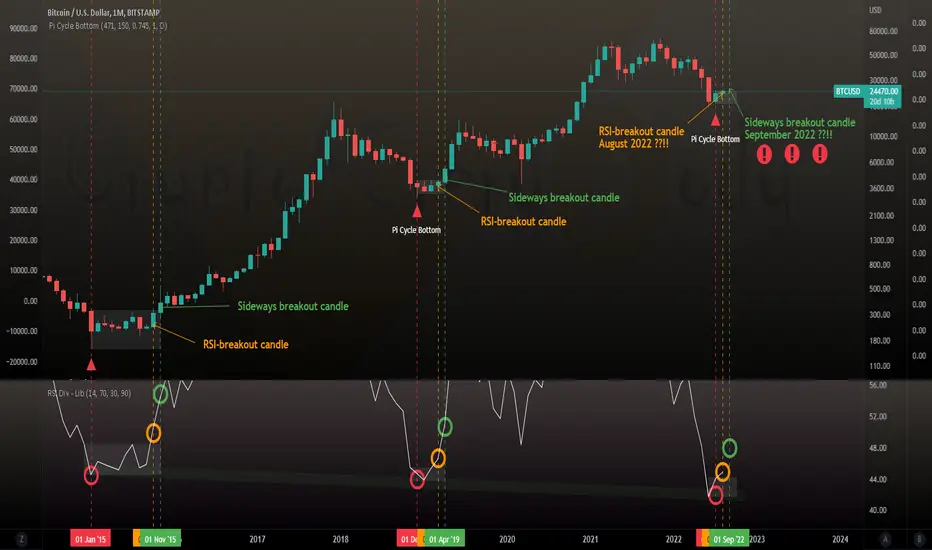
Bitcoin long-term view - bottom time decreasing ??!!
Of course only few BTC data points - but comparing the bottom phase 2015 and 2019 we can see a reduced length (10 month >> 4 month)
Will the current bottom phase (if we are in it) be again reduced ?!
Explanation:
red - candle of PI cycle bottom
yellow - candle breaking out on RSI
green - candle breaking out sideways action (start bull run)
What are your thoughts dear Crypto Nation?
*not financial advice
do your own research before investing
Of course only few BTC data points - but comparing the bottom phase 2015 and 2019 we can see a reduced length (10 month >> 4 month)
Will the current bottom phase (if we are in it) be again reduced ?!
Explanation:
red - candle of PI cycle bottom
yellow - candle breaking out on RSI
green - candle breaking out sideways action (start bull run)
What are your thoughts dear Crypto Nation?
*not financial advice
do your own research before investing

כתב ויתור
המידע והפרסומים אינם מיועדים להיות, ואינם מהווים, ייעוץ או המלצה פיננסית, השקעתית, מסחרית או מכל סוג אחר המסופקת או מאושרת על ידי TradingView. קרא עוד ב־תנאי השימוש.
כתב ויתור
המידע והפרסומים אינם מיועדים להיות, ואינם מהווים, ייעוץ או המלצה פיננסית, השקעתית, מסחרית או מכל סוג אחר המסופקת או מאושרת על ידי TradingView. קרא עוד ב־תנאי השימוש.