
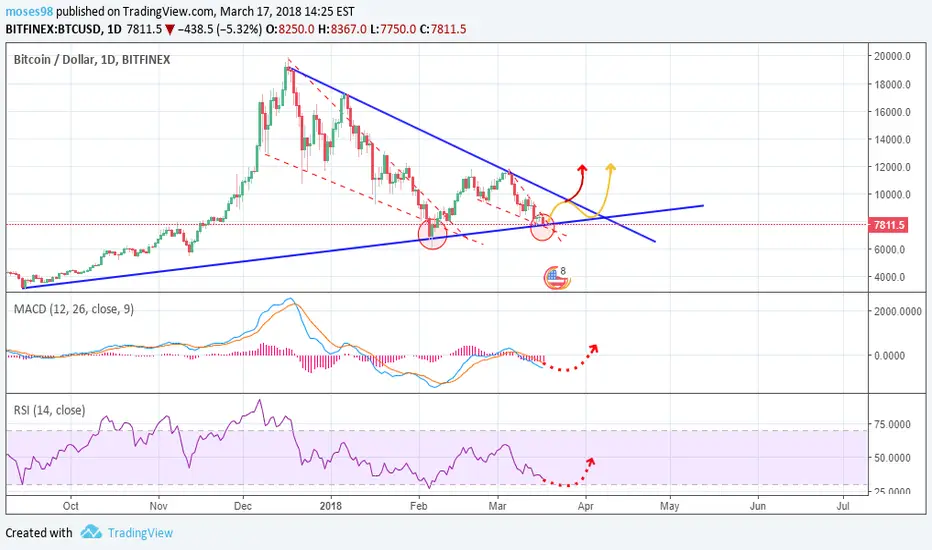
Hello traders! Here we have BTC/USD. As you can see from TA we are fighting with the downtrend resistance line (dotted red line). (red dotted line) is showing a forming a descending wedge'ish pattern - I think, it's more likely, that we will follow this path down to around ~7,300USD levels (red dotted line) and then see a spike in price.
MACD & RSI indicators are starting to gain momentum.
RSI is near oversold mark.
MACD is below average.
MACD & RSI indicators are starting to gain momentum.
RSI is near oversold mark.
MACD is below average.

פרסומים קשורים
כתב ויתור
המידע והפרסומים אינם מיועדים להיות, ואינם מהווים, ייעוץ או המלצה פיננסית, השקעתית, מסחרית או מכל סוג אחר המסופקת או מאושרת על ידי TradingView. קרא עוד ב־תנאי השימוש.
כתב ויתור
המידע והפרסומים אינם מיועדים להיות, ואינם מהווים, ייעוץ או המלצה פיננסית, השקעתית, מסחרית או מכל סוג אחר המסופקת או מאושרת על ידי TradingView. קרא עוד ב־תנאי השימוש.