
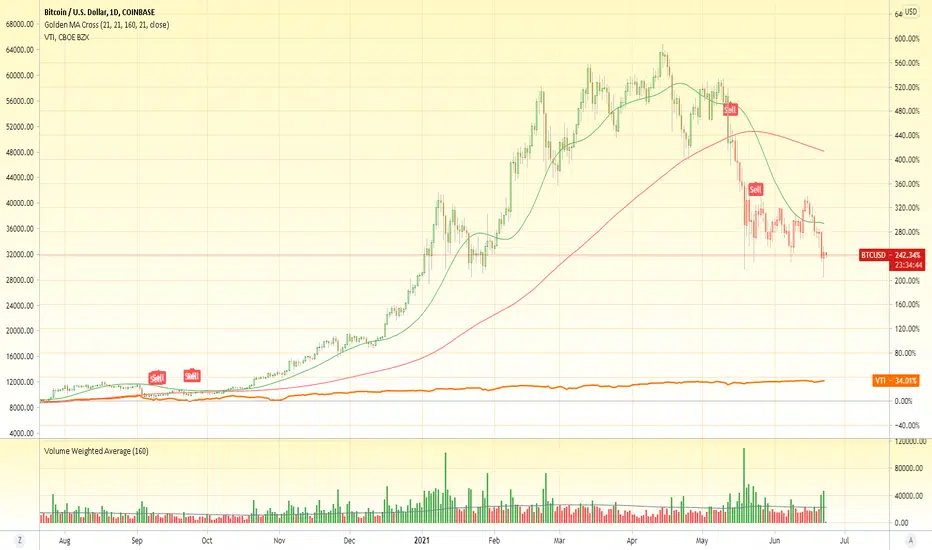
Here, a daily chart to compare Bitcoin and Vanguard Total Stock Index. A nice visual to track the performance of one to another, and also to compare at other timeframes. In a 15 min chart for example, we can clearly view the dip on BTC under the VTI. Using a 21 and a 160 WMA for testing.
For educational purposes only and not intended as a financial advice of any kind.
For educational purposes only and not intended as a financial advice of any kind.

כתב ויתור
המידע והפרסומים אינם מיועדים להיות, ואינם מהווים, ייעוץ או המלצה פיננסית, השקעתית, מסחרית או מכל סוג אחר המסופקת או מאושרת על ידי TradingView. קרא עוד ב־תנאי השימוש.
כתב ויתור
המידע והפרסומים אינם מיועדים להיות, ואינם מהווים, ייעוץ או המלצה פיננסית, השקעתית, מסחרית או מכל סוג אחר המסופקת או מאושרת על ידי TradingView. קרא עוד ב־תנאי השימוש.