
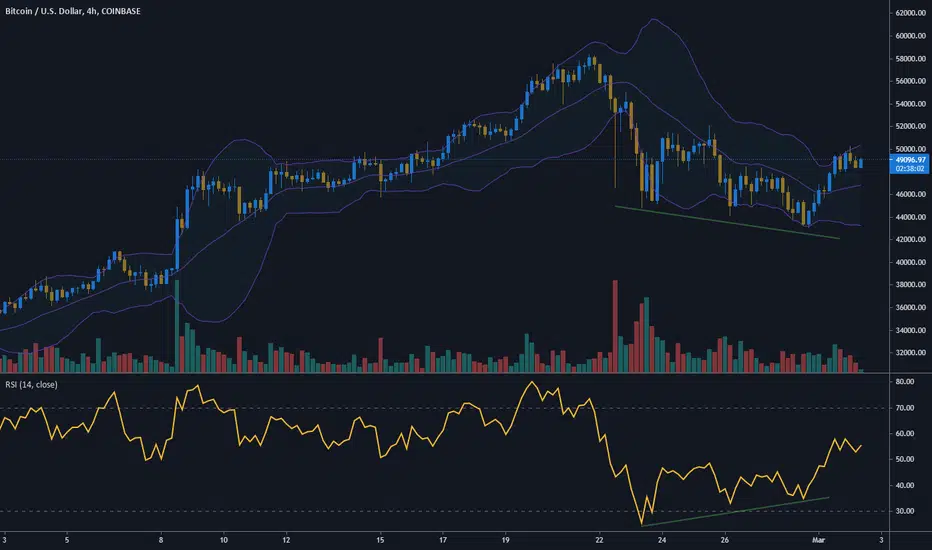
On the 4 hours chart, there is a divergence between the price and the RSI.
The price is doing lower lows but the RSI is doing higher lows.
In every new low, the price penetrates less and less the lower bollinger band.
Bullish.
The price is doing lower lows but the RSI is doing higher lows.
In every new low, the price penetrates less and less the lower bollinger band.
Bullish.

כתב ויתור
המידע והפרסומים אינם מיועדים להיות, ואינם מהווים, ייעוץ או המלצה פיננסית, השקעתית, מסחרית או מכל סוג אחר המסופקת או מאושרת על ידי TradingView. קרא עוד ב־תנאי השימוש.
כתב ויתור
המידע והפרסומים אינם מיועדים להיות, ואינם מהווים, ייעוץ או המלצה פיננסית, השקעתית, מסחרית או מכל סוג אחר המסופקת או מאושרת על ידי TradingView. קרא עוד ב־תנאי השימוש.