
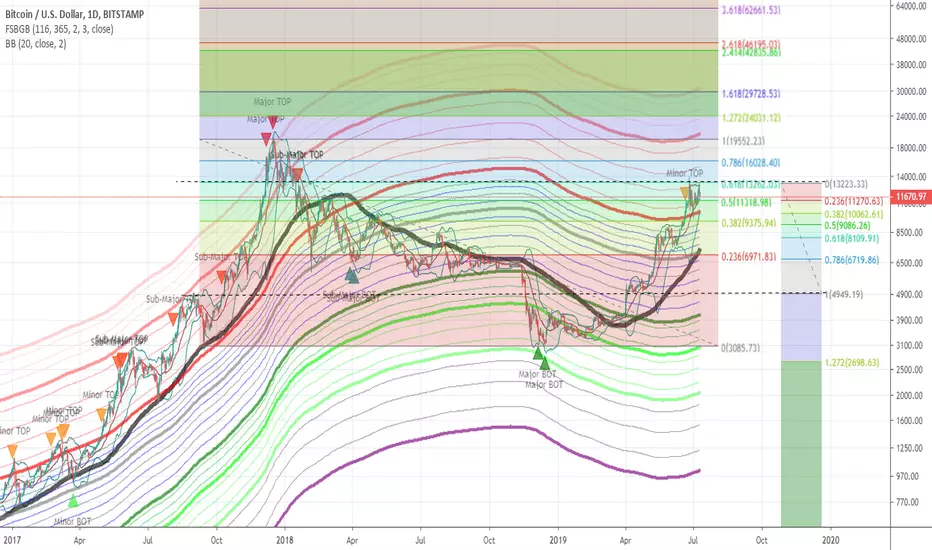
BTC presently expected to double top at 0.618 level of longer-term trend.
Expect BTC to fall back to around 8400 at 0.618 level of shorter-term trend.
Analysis rejected if double top fails, and BTC goes higher beyond and shows strong support above 14k.
See also:
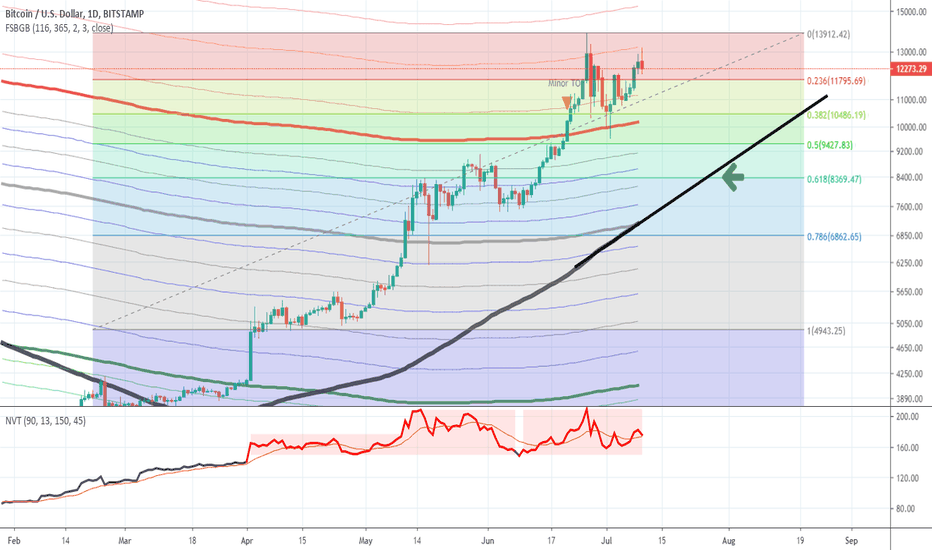
Expect BTC to fall back to around 8400 at 0.618 level of shorter-term trend.
Analysis rejected if double top fails, and BTC goes higher beyond and shows strong support above 14k.
See also:
הערה
Explaination: The FSBGB indicator shows that historically, we have presently reached a local top corresponding to the FSBGB-levels where local-tops were logged during the stage of the bull-market from 2016 till April of 2017, before the "red" FSBGB-level was eventually breached.הערה
Link to indicator used: tradingview.com/v/N0FyoIlB/
כתב ויתור
המידע והפרסומים אינם מיועדים להיות, ואינם מהווים, ייעוץ או המלצה פיננסית, השקעתית, מסחרית או מכל סוג אחר המסופקת או מאושרת על ידי TradingView. קרא עוד ב־תנאי השימוש.
כתב ויתור
המידע והפרסומים אינם מיועדים להיות, ואינם מהווים, ייעוץ או המלצה פיננסית, השקעתית, מסחרית או מכל סוג אחר המסופקת או מאושרת על ידי TradingView. קרא עוד ב־תנאי השימוש.