
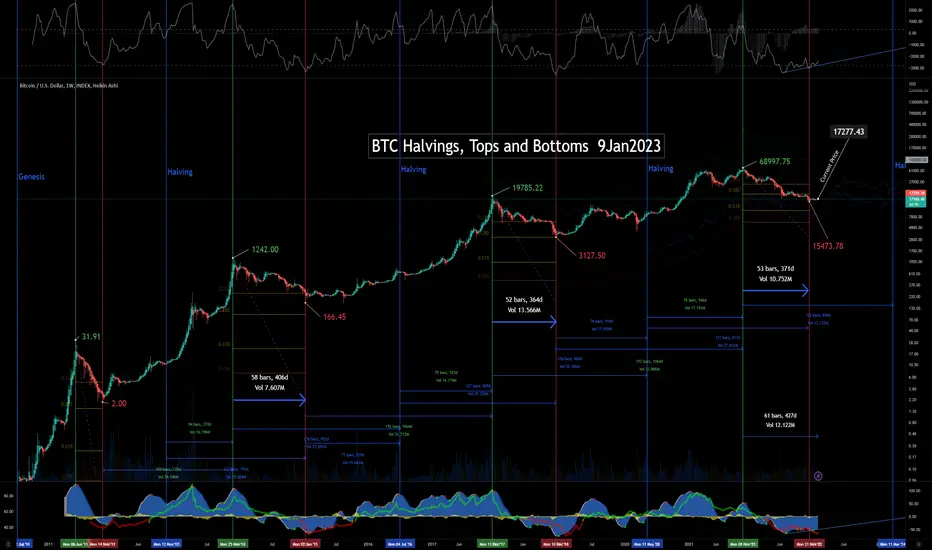
Latest update of an X-axis chart. Prices labeled for all cycle tops and bottoms. Dates marked for tops, bottoms and halvings.
Could easily see a 2x of previous ATH in 2025. Expecting slow trend upward with volatility increasing into the halving/ Fed pivot, then a parabolic 5-wave run up above 100k in 2025.
This version also includes time measurements of relevant cycle relationships.
Could easily see a 2x of previous ATH in 2025. Expecting slow trend upward with volatility increasing into the halving/ Fed pivot, then a parabolic 5-wave run up above 100k in 2025.
This version also includes time measurements of relevant cycle relationships.

כתב ויתור
המידע והפרסומים אינם מיועדים להיות, ואינם מהווים, ייעוץ או המלצה פיננסית, השקעתית, מסחרית או מכל סוג אחר המסופקת או מאושרת על ידי TradingView. קרא עוד ב־תנאי השימוש.
כתב ויתור
המידע והפרסומים אינם מיועדים להיות, ואינם מהווים, ייעוץ או המלצה פיננסית, השקעתית, מסחרית או מכל סוג אחר המסופקת או מאושרת על ידי TradingView. קרא עוד ב־תנאי השימוש.