
 BTCUSDT.P
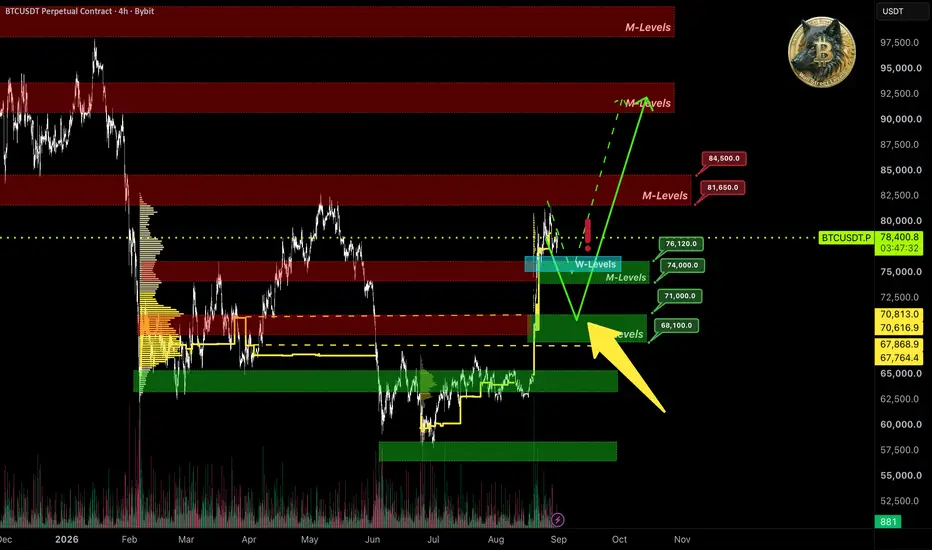
As seen on the chart, price continues trading between monthly 📊M-Levels, showing no clear direction.
🧩IMA data shows that after the bounce from resistance, 🐋large players partially took profits on their longs. Meanwhile, capital outflow from the spot market continued.
The shortened Sunday 🇺🇸US session didn't give a clear signal on market sentiment. Right now, it's important to see what the full Monday session shows.
Judging by 🐋large players' behavior, the monthly support at 📊M-Levels $74000–$76000 is highly likely to get broken. In that case, we can expect price to drop into the $68000–$70000 area, which lines up with the volume level.
If the idea was useful — glad to have your support 🚀.
📊M-Levels — institutional interest levels.
🧩IMA — Integrated Market Analysis
⚠️ Closed algorithms don't show on the chart. Only key levels are displayed.

More trading signals in my channel: t.me/well_street_levels
פרסומים קשורים
כתב ויתור
המידע והפרסומים אינם מיועדים להיות, ואינם מהווים, ייעוץ או המלצה פיננסית, השקעתית, מסחרית או מכל סוג אחר המסופקת או מאושרת על ידי TradingView. קרא עוד ב־תנאי השימוש.
More trading signals in my channel: t.me/well_street_levels
פרסומים קשורים
כתב ויתור
המידע והפרסומים אינם מיועדים להיות, ואינם מהווים, ייעוץ או המלצה פיננסית, השקעתית, מסחרית או מכל סוג אחר המסופקת או מאושרת על ידי TradingView. קרא עוד ב־תנאי השימוש.