
Trader’s Mindset: The First Fundamental Stone & Key Observations
Trader’s Mindset: The First Fundamental Stone of the Market
Stop asking, “How much profit did I make?”
Start asking, “What is my winning probability?”
📊 In trading, consistency beats randomness.
It’s not about one big win — it’s about repeating a high-probability edge again and again.
💭 Smart traders don’t chase money…
They focus on accuracy, discipline, and data-backed decisions.
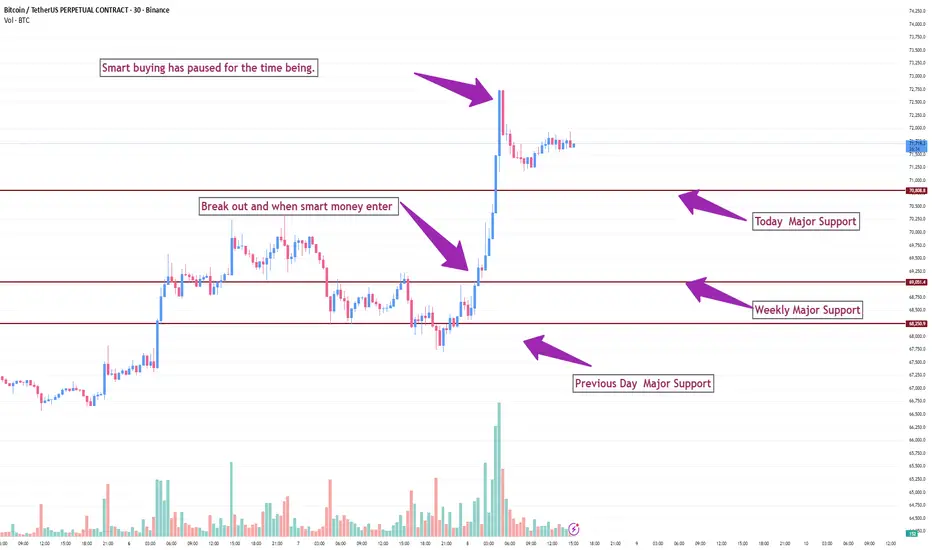
TradingView chart for the Bitcoin/Tether Perpetual Contract (30m timeframe, April 8, 2026), .
Key Observations:
Sequential Breakouts: The move originated with a breakout above the 'Weekly Major Support' level (approx. $69,400). This was followed by a subsequent breakout with significant volume above 'Today’s Major Support' (approx. $71,800), labelled as an entry by "smart money."
Current State: Following this surge, upward momentum has slowed ("Smart buying has paused"). Price is currently in a technical pullback, retesting the 'Today’s Major Support' level.
Support Structure: The chart identifies three distinct support levels: Today's ($71,800), Weekly ($69,400), and Previous Day ($68,200).
Stop asking, “How much profit did I make?”
Start asking, “What is my winning probability?”
📊 In trading, consistency beats randomness.
It’s not about one big win — it’s about repeating a high-probability edge again and again.
💭 Smart traders don’t chase money…
They focus on accuracy, discipline, and data-backed decisions.
TradingView chart for the Bitcoin/Tether Perpetual Contract (30m timeframe, April 8, 2026), .
Key Observations:
Sequential Breakouts: The move originated with a breakout above the 'Weekly Major Support' level (approx. $69,400). This was followed by a subsequent breakout with significant volume above 'Today’s Major Support' (approx. $71,800), labelled as an entry by "smart money."
Current State: Following this surge, upward momentum has slowed ("Smart buying has paused"). Price is currently in a technical pullback, retesting the 'Today’s Major Support' level.
Support Structure: The chart identifies three distinct support levels: Today's ($71,800), Weekly ($69,400), and Previous Day ($68,200).

כתב ויתור
המידע והפרסומים אינם מיועדים להיות, ואינם מהווים, ייעוץ או המלצה פיננסית, השקעתית, מסחרית או מכל סוג אחר המסופקת או מאושרת על ידי TradingView. קרא עוד ב־תנאי השימוש.
כתב ויתור
המידע והפרסומים אינם מיועדים להיות, ואינם מהווים, ייעוץ או המלצה פיננסית, השקעתית, מסחרית או מכל סוג אחר המסופקת או מאושרת על ידי TradingView. קרא עוד ב־תנאי השימוש.