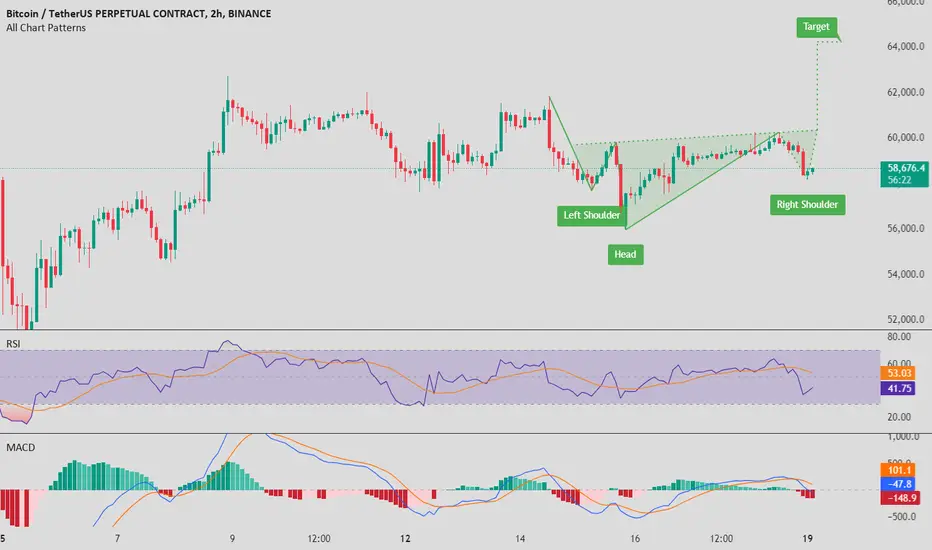
This 2-hour  BTC chart is showing a classic inverse head and shoulders pattern, which typically signals a bullish reversal. We can see that the right shoulder is currently forming, and if the pattern plays out, the price target could be around $64,000. The RSI has dipped below the midline, indicating a brief pullback, but it’s still in a healthy range. The MACD is in a bearish phase, but it could be signaling a potential bottom. Keep an eye on the neckline around $59,000; if BTC can break above that, it could confirm the bullish move.
כתב ויתור
המידע והפרסומים אינם מיועדים להיות, ואינם מהווים, ייעוץ או המלצה פיננסית, השקעתית, מסחרית או מכל סוג אחר המסופקת או מאושרת על ידי TradingView. קרא עוד ב־תנאי השימוש.
כתב ויתור
המידע והפרסומים אינם מיועדים להיות, ואינם מהווים, ייעוץ או המלצה פיננסית, השקעתית, מסחרית או מכל סוג אחר המסופקת או מאושרת על ידי TradingView. קרא עוד ב־תנאי השימוש.