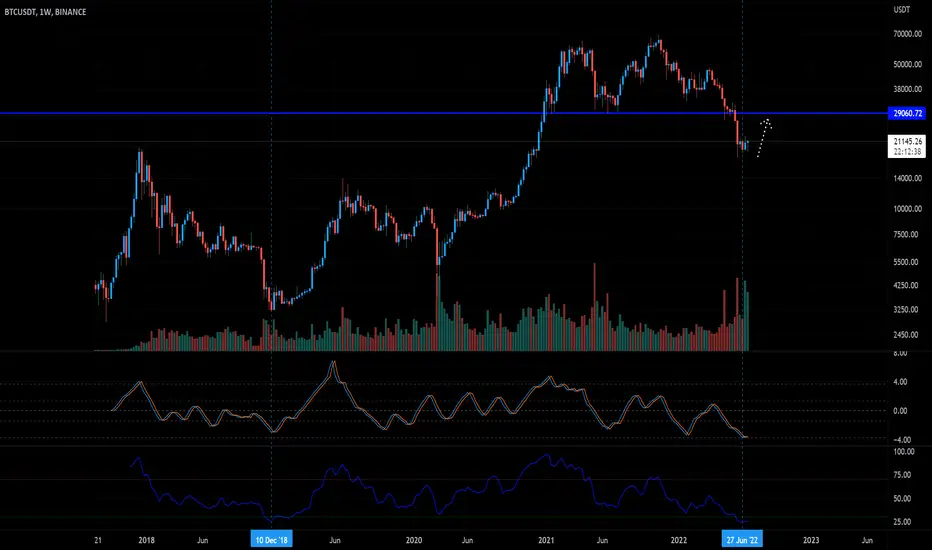
I'm thinking we see a retest of the previous support region around 29-30k before BTC attempts any further downward attempts
The weekly RSI here showing we are at a similar level to the 2018-19 bottom, Could we see an unexpected bullish swing upwards? Fisher indicator also showing signs of a reversal (crossing up)
Interesting point for BTC to be, time will tell.

 BTCUSDTBTCUSDBTCUSDBTCUSD
הערה
There's a cheeky bullish harmonic on the weekly tooהערה
just look at the volume on the last green 2-week, higher than the dump candles, indicates reversal (just looking at volume)and you have the massive 2-weekly bullish harmonic that everyone seems to be ignoring.. these harmonics play out on almost all TF's.. it's extremely rare to get one on a high TF like the 2-week
הערה
Related charts are scattered throughout this idea:
הערה
Looking stronger on the chance of the bullish reversal harmonic playing out!הערה
closed 2-week above S2 which was an issue for a whileהערה
Still chilling around here for now, no sign of invalidation yet which is good

פרסומים קשורים
כתב ויתור
המידע והפרסומים אינם מיועדים להיות, ואינם מהווים, ייעוץ או המלצה פיננסית, השקעתית, מסחרית או מכל סוג אחר המסופקת או מאושרת על ידי TradingView. קרא עוד ב־תנאי השימוש.
פרסומים קשורים
כתב ויתור
המידע והפרסומים אינם מיועדים להיות, ואינם מהווים, ייעוץ או המלצה פיננסית, השקעתית, מסחרית או מכל סוג אחר המסופקת או מאושרת על ידי TradingView. קרא עוד ב־תנאי השימוש.