
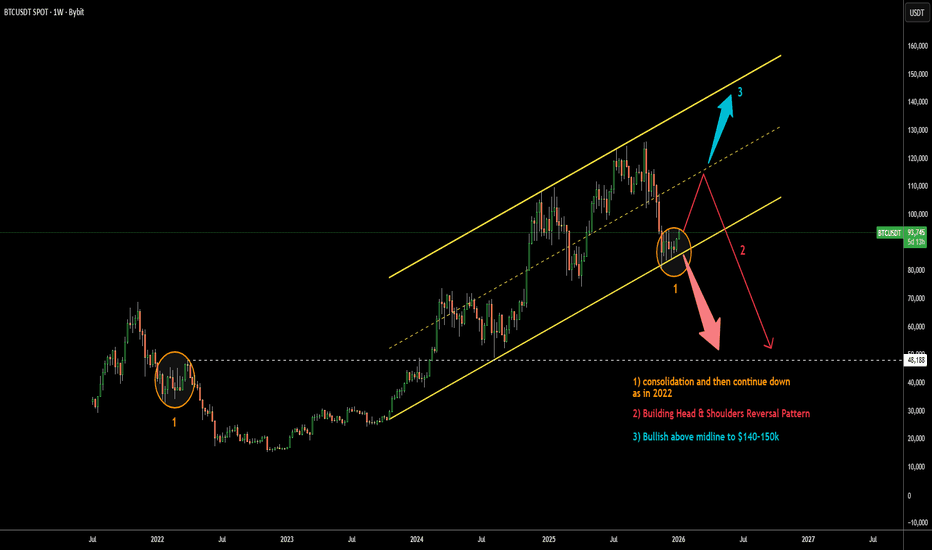
Back in January, I posted the map with three scenarios for Bitcoin price
Price followed the second path (red marks) building the well-known Head & Shoulders pattern
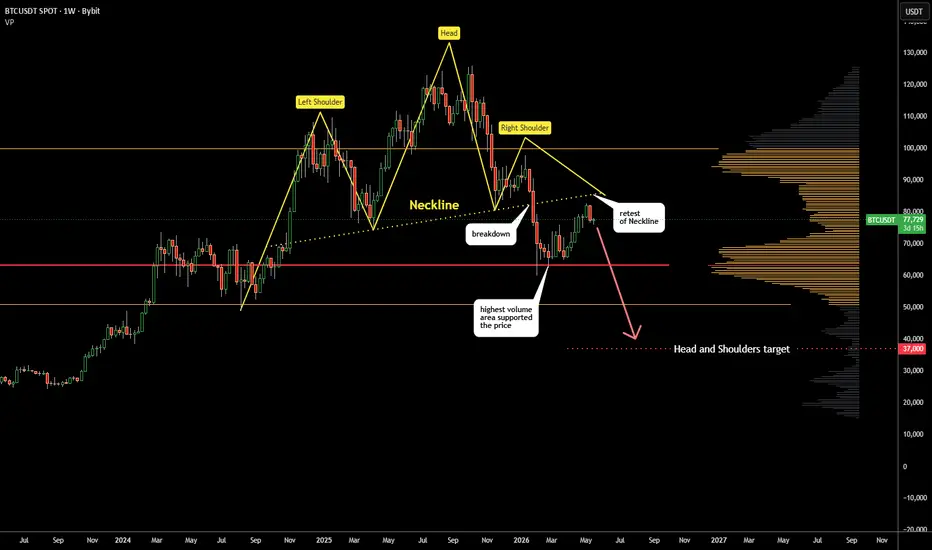
Here is its actual shape in the chart with yellow marks
The pattern was triggered on the breakdown of the Neckline
It quickly dropped down and could find support only at $63k
where we can see the highest volume traded PoC red line based on volume profile
Classic retest of the broken Neckline has followed and the price almost hit the trendline
The resumption of price weakness is expected to emerge aiming at
Head & Shoulders pattern target at $37k
$63k support is the only obstacle based on volume profile
Invalidation of the pattern is at the top of Right Shoulder above $98k
where decent volume profile based resistance is located
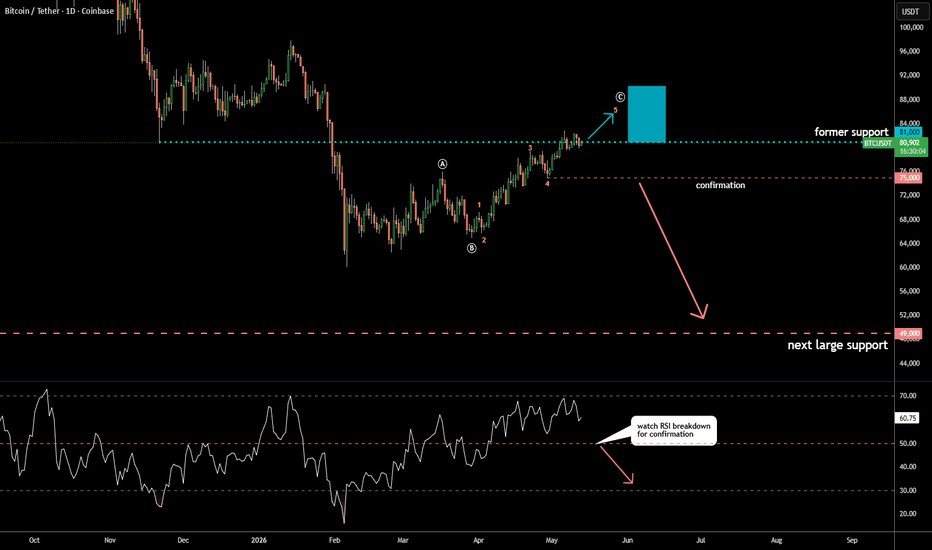
This pattern aligns pretty well with EW count posted last week
Price followed the second path (red marks) building the well-known Head & Shoulders pattern
Here is its actual shape in the chart with yellow marks
The pattern was triggered on the breakdown of the Neckline
It quickly dropped down and could find support only at $63k
where we can see the highest volume traded PoC red line based on volume profile
Classic retest of the broken Neckline has followed and the price almost hit the trendline
The resumption of price weakness is expected to emerge aiming at
Head & Shoulders pattern target at $37k
$63k support is the only obstacle based on volume profile
Invalidation of the pattern is at the top of Right Shoulder above $98k
where decent volume profile based resistance is located
This pattern aligns pretty well with EW count posted last week

פרסומים קשורים
כתב ויתור
המידע והפרסומים אינם מיועדים להיות, ואינם מהווים, ייעוץ או המלצה פיננסית, השקעתית, מסחרית או מכל סוג אחר המסופקת או מאושרת על ידי TradingView. קרא עוד ב־תנאי השימוש.
כתב ויתור
המידע והפרסומים אינם מיועדים להיות, ואינם מהווים, ייעוץ או המלצה פיננסית, השקעתית, מסחרית או מכל סוג אחר המסופקת או מאושרת על ידי TradingView. קרא עוד ב־תנאי השימוש.