
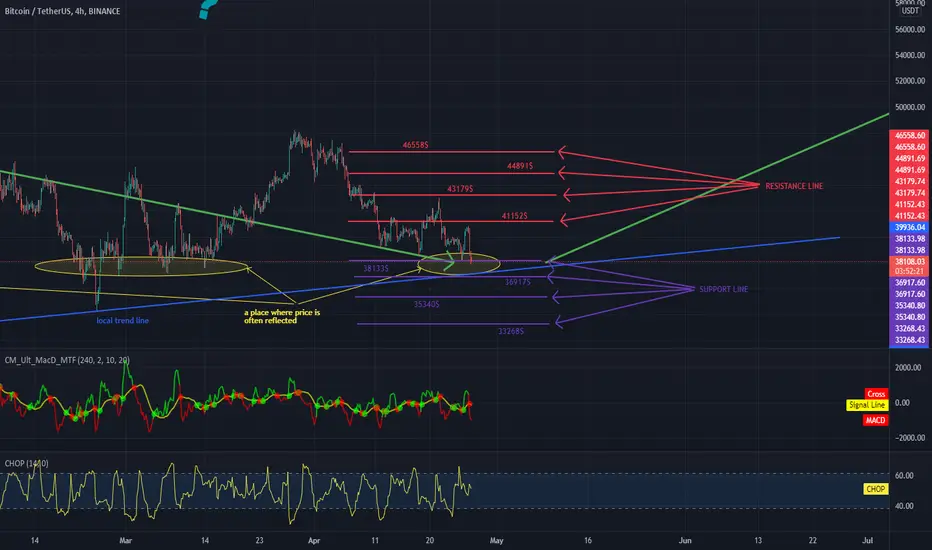
Hello everyone, let's take a look at the BTC to USDT chart over the 4 hour timeframe. As you can see, price is moving above the local uptrend line.
Let's start with the designation of the support line and as you can see the first support that the price is currently based on is $ 38,133, if the support breaks down, the next is $ 36,917 and $ 35,340 and $ 33,268.
Now let's move from the resistance line, as you can see, the first resistance is $ 41,152, if you can break it, the next resistance will be $ 43,179 and $ 44,891 plus $ 46,558.
Looking at the CHOP indicator, we can see that in the 4-hour interval some energy was used for the downward move, but there is still a lot of energy that can be used in the near future, please be careful.
Let's start with the designation of the support line and as you can see the first support that the price is currently based on is $ 38,133, if the support breaks down, the next is $ 36,917 and $ 35,340 and $ 33,268.
Now let's move from the resistance line, as you can see, the first resistance is $ 41,152, if you can break it, the next resistance will be $ 43,179 and $ 44,891 plus $ 46,558.
Looking at the CHOP indicator, we can see that in the 4-hour interval some energy was used for the downward move, but there is still a lot of energy that can be used in the near future, please be careful.

כתב ויתור
המידע והפרסומים אינם מיועדים להיות, ואינם מהווים, ייעוץ או המלצה פיננסית, השקעתית, מסחרית או מכל סוג אחר המסופקת או מאושרת על ידי TradingView. קרא עוד ב־תנאי השימוש.
כתב ויתור
המידע והפרסומים אינם מיועדים להיות, ואינם מהווים, ייעוץ או המלצה פיננסית, השקעתית, מסחרית או מכל סוג אחר המסופקת או מאושרת על ידי TradingView. קרא עוד ב־תנאי השימוש.