
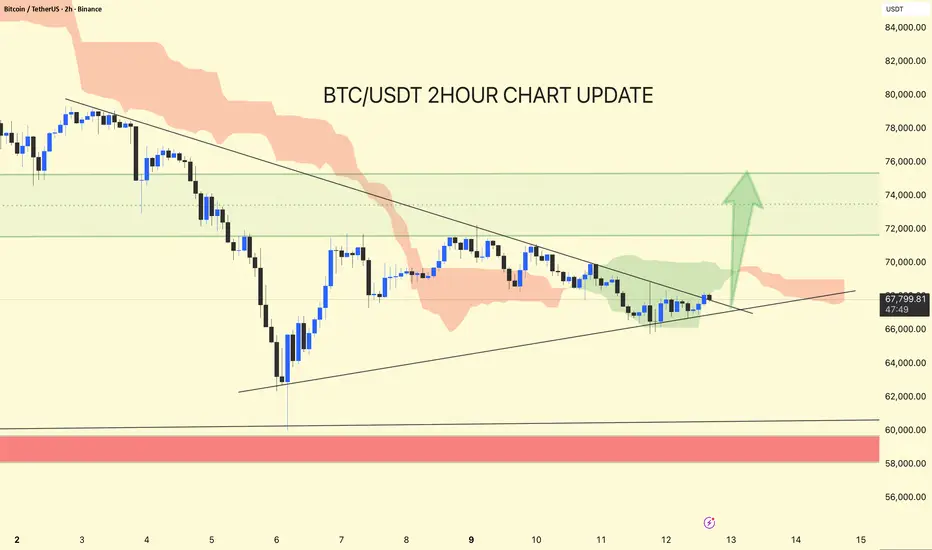
BTC/USDT – 2H Chart Update
BTC is compressing between a descending resistance trendline and rising short-term support, forming a tightening wedge structure around 67K.
Price holding above 66K local support
Descending trendline near 68.5K–69K acting as a pressure zone
Ichimoku cloud thinning → momentum slowdown, breakout setup forming.
Support: 66,000–65,500
Major Macro Support: 60,000–58,500
Resistance: 69,000
Breakout Confirmation: 70,000+
If BTC breaks above 69–70K with strength, upside momentum can extend toward 73K–75K liquidity zone.
Failure to hold 66K may trigger another sweep toward 64K before any recovery.
⚠️ Wait for breakout confirmation
BTC is compressing between a descending resistance trendline and rising short-term support, forming a tightening wedge structure around 67K.
Price holding above 66K local support
Descending trendline near 68.5K–69K acting as a pressure zone
Ichimoku cloud thinning → momentum slowdown, breakout setup forming.
Support: 66,000–65,500
Major Macro Support: 60,000–58,500
Resistance: 69,000
Breakout Confirmation: 70,000+
If BTC breaks above 69–70K with strength, upside momentum can extend toward 73K–75K liquidity zone.
Failure to hold 66K may trigger another sweep toward 64K before any recovery.
⚠️ Wait for breakout confirmation

פרסומים קשורים
כתב ויתור
המידע והפרסומים אינם מיועדים להיות, ואינם מהווים, ייעוץ או המלצה פיננסית, השקעתית, מסחרית או מכל סוג אחר המסופקת או מאושרת על ידי TradingView. קרא עוד ב־תנאי השימוש.
פרסומים קשורים
כתב ויתור
המידע והפרסומים אינם מיועדים להיות, ואינם מהווים, ייעוץ או המלצה פיננסית, השקעתית, מסחרית או מכל סוג אחר המסופקת או מאושרת על ידי TradingView. קרא עוד ב־תנאי השימוש.