
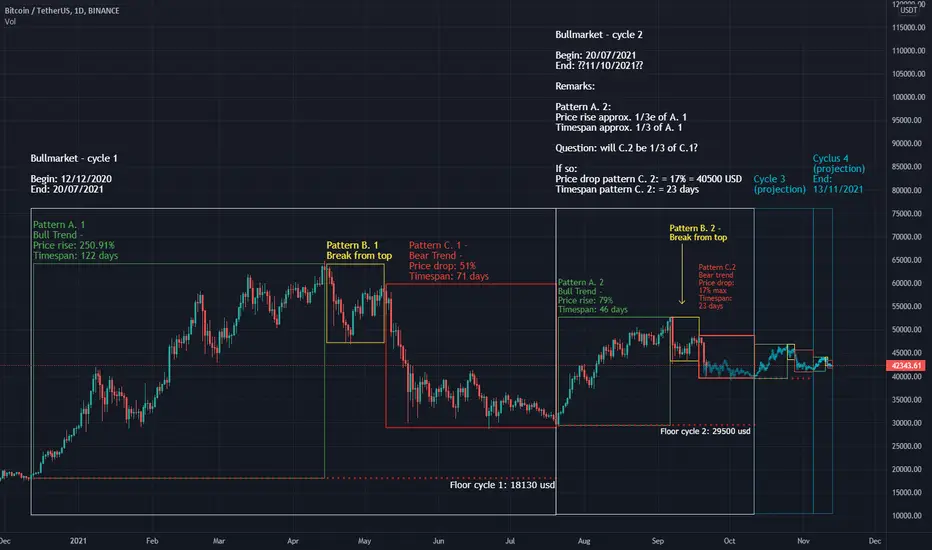
This analysis highlights the patterns that repeat on the daily BTC-USDT chart, and projects what were to happen if these patterns were to keep repeating.
It shows the emergence of a symmetrical wedge.
This leads to a second chart, illustrating the symmetrical wedge poised for breakout second half of November to a top of 90.000 USD / BTC. It is linked as a related idea.
It shows the emergence of a symmetrical wedge.
This leads to a second chart, illustrating the symmetrical wedge poised for breakout second half of November to a top of 90.000 USD / BTC. It is linked as a related idea.

כתב ויתור
המידע והפרסומים אינם מיועדים להיות, ואינם מהווים, ייעוץ או המלצה פיננסית, השקעתית, מסחרית או מכל סוג אחר המסופקת או מאושרת על ידי TradingView. קרא עוד ב־תנאי השימוש.
כתב ויתור
המידע והפרסומים אינם מיועדים להיות, ואינם מהווים, ייעוץ או המלצה פיננסית, השקעתית, מסחרית או מכל סוג אחר המסופקת או מאושרת על ידי TradingView. קרא עוד ב־תנאי השימוש.