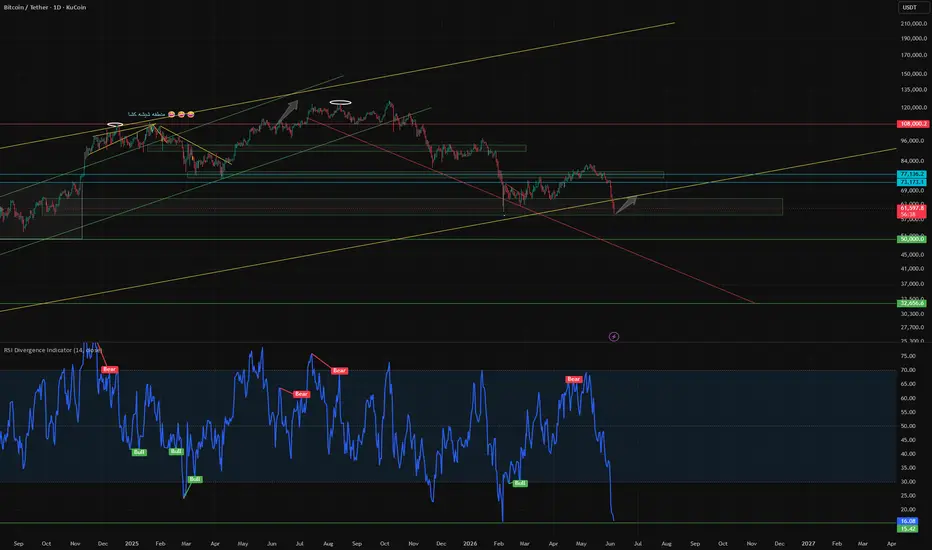
 BTC BTC Daily Analysis – Current Price: $60,000
On the daily timeframe, Bitcoin remains in a corrective structure after recent downside pressure, but it has now reached a key support zone around $60,000 where most oscillators have entered oversold territory.
RSI is in Extreme Oversold, MFI is Oversold, CCI shows Strong Oversold, and Stochastic is also Oversold – a rare alignment across all major momentum indicators. Historically, such extreme conditions near a major support level often precede at least a short-term rebound.
ATR shows high volatility, volume is very high, and ADX remains strong, indicating the downtrend is still intact but showing signs of seller exhaustion. The low Up/Down ratio (0.29) confirms recent bearish dominance.
Possible scenarios:
🟢 65% probability:
A temporary bottom forms at current levels, leading to a relief rally toward $64,000 – $68,000.
🟡 20% probability:
Several weeks of consolidation between $58,000 and $62,000 to absorb selling pressure.
🔴 15% probability:
Break of $60,000 support and continuation toward $56,000 – $54,000.
Downside risk appears limited at these levels, while the potential for a mean-reversion bounce is increasing. The combination of oversold oscillators and high volume suggests accumulation interest beneath the surface.
My personal view:
This area resembles an accumulation zone rather than a distribution phase. A bounce toward $64,000 – $65,000 is likely before any further directional decision.
DrKhashix loves you all
#BTC #Bitcoin #Crypto#
image

כתב ויתור
המידע והפרסומים אינם מיועדים להיות, ואינם מהווים, ייעוץ או המלצה פיננסית, השקעתית, מסחרית או מכל סוג אחר המסופקת או מאושרת על ידי TradingView. קרא עוד ב־תנאי השימוש.
כתב ויתור
המידע והפרסומים אינם מיועדים להיות, ואינם מהווים, ייעוץ או המלצה פיננסית, השקעתית, מסחרית או מכל סוג אחר המסופקת או מאושרת על ידי TradingView. קרא עוד ב־תנאי השימוש.