
Hello,
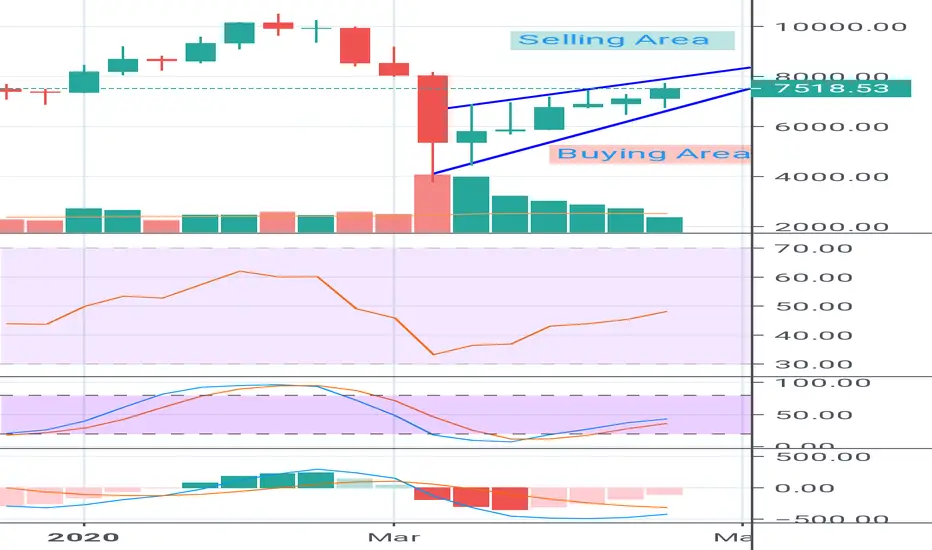
Looking at the weekly chart (1 week per candlestick ) shows:
1- A steady uptrend price.
2- A declining trading volume .
3- A steady uptrend RSI touching 50.
4- The 'main' & 'second' lines in the StochRSI are narrowing and have steady uptrend almost touching 50.
5- The MACD Bearish zone is ending, and the signal lines are almost touching (indicates a change).
The price is oscillating but maintaining a steady uptrend, regardless of all the bad economic news (#USA #Oil, #CoronaVirus, etc...)
Long live the King ( BTC )
If you agree, kindly like and share.
Thank you.@BuyBitcoinLeb
Looking at the weekly chart (1 week per candlestick ) shows:
1- A steady uptrend price.
2- A declining trading volume .
3- A steady uptrend RSI touching 50.
4- The 'main' & 'second' lines in the StochRSI are narrowing and have steady uptrend almost touching 50.
5- The MACD Bearish zone is ending, and the signal lines are almost touching (indicates a change).
The price is oscillating but maintaining a steady uptrend, regardless of all the bad economic news (#USA #Oil, #CoronaVirus, etc...)
Long live the King ( BTC )
If you agree, kindly like and share.
Thank you.@BuyBitcoinLeb

כתב ויתור
המידע והפרסומים אינם מיועדים להיות, ואינם מהווים, ייעוץ או המלצה פיננסית, השקעתית, מסחרית או מכל סוג אחר המסופקת או מאושרת על ידי TradingView. קרא עוד ב־תנאי השימוש.
כתב ויתור
המידע והפרסומים אינם מיועדים להיות, ואינם מהווים, ייעוץ או המלצה פיננסית, השקעתית, מסחרית או מכל סוג אחר המסופקת או מאושרת על ידי TradingView. קרא עוד ב־תנאי השימוש.