
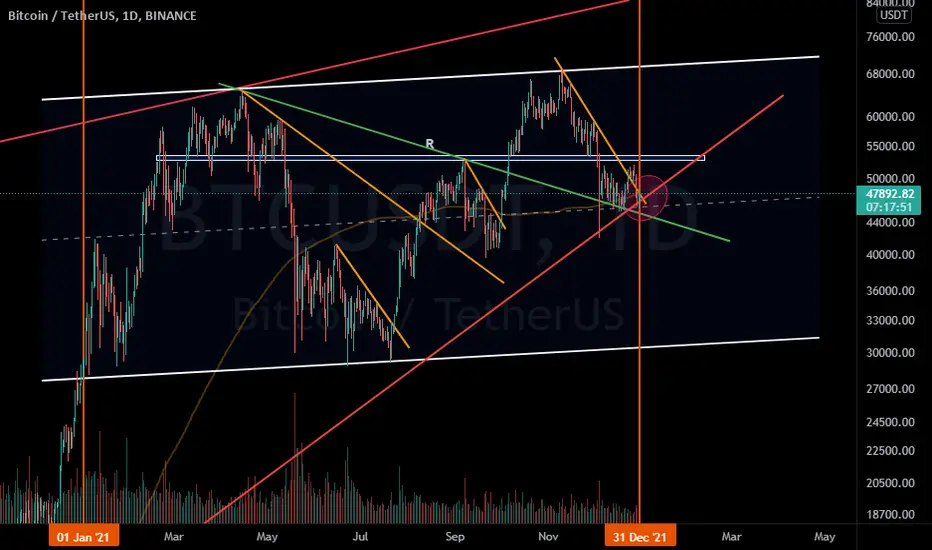
This is how started and how ended.
On the last day of the year, Bitcoin has several supports:
+ Long term trend line (Since March 2020)
+ 200 MA
+ Midline of channel (see it in chart)
+ That green line (see it in chart)
- Bitcoin on-chain data don't have good news
- Any support can be broken
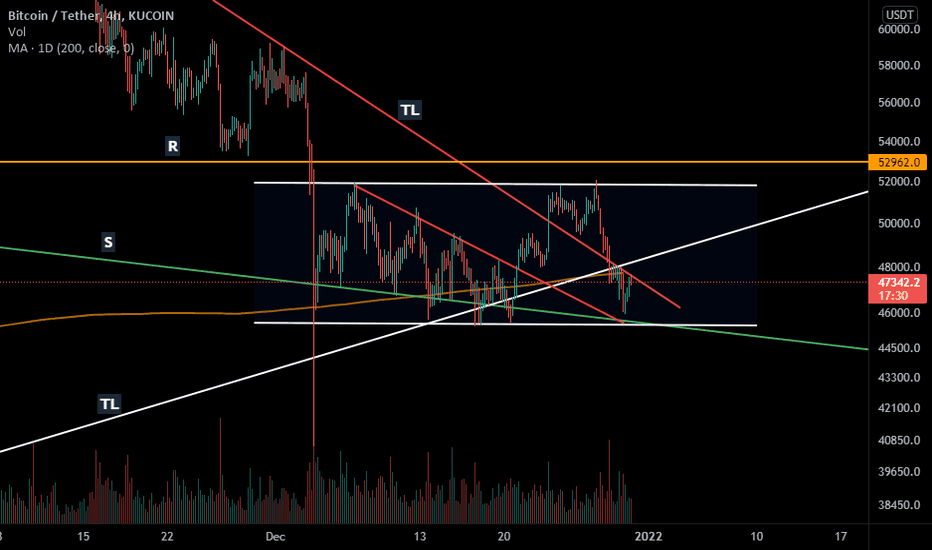
BTC price is stuck between this two levels (51900 - 45500)
This is my idea:
If 52k breaks, I'm bullish but if 45500 breaks, I imagine 40 and 30.
Price is in wave C of wave 4th. After that I expect the bullish fifth wave
I could be wrong.
On the last day of the year, Bitcoin has several supports:
+ Long term trend line (Since March 2020)
+ 200 MA
+ Midline of channel (see it in chart)
+ That green line (see it in chart)
- Bitcoin on-chain data don't have good news
- Any support can be broken
BTC price is stuck between this two levels (51900 - 45500)
This is my idea:
If 52k breaks, I'm bullish but if 45500 breaks, I imagine 40 and 30.
Price is in wave C of wave 4th. After that I expect the bullish fifth wave
I could be wrong.
הערה
הערה
Happy new year to you all
כתב ויתור
המידע והפרסומים אינם מיועדים להיות, ואינם מהווים, ייעוץ או המלצה פיננסית, השקעתית, מסחרית או מכל סוג אחר המסופקת או מאושרת על ידי TradingView. קרא עוד ב־תנאי השימוש.
כתב ויתור
המידע והפרסומים אינם מיועדים להיות, ואינם מהווים, ייעוץ או המלצה פיננסית, השקעתית, מסחרית או מכל סוג אחר המסופקת או מאושרת על ידי TradingView. קרא עוד ב־תנאי השימוש.