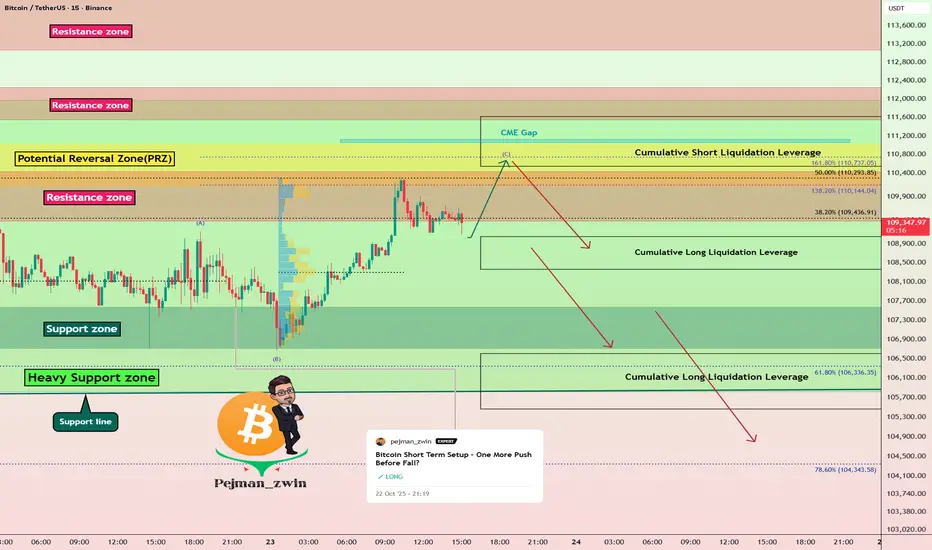
As I expected yesterday, Bitcoin(
 BTCUSDT) started rising from the Support zone($107,580-$106,700) and has now hit its Target at the Resistance zone($110,430-$109,380).
Now the question is: will Bitcoin continue its short-term uptrend in the next few hours, or is it going to drop again? Stay with me to find out.
Bitcoin is trading near the Resistance zone($110,430-$109,380), Potential Reversal Zone(PRZ)[$111,000-$110,130], and Cumulative Short Liquidation Leverage($111,613-$110,542).
From an Elliott Wave perspective, it seems that Bitcoin is completing the wave C of an Expanding Flat Corrective Pattern(ABC/3-3-5).
Given that the S&P 500( SPX) (which has recently been correlated with Bitcoin) is likely to drop when the U.S. market opens, I expect Bitcoin to resume its decline. This next drop might be the final push to break the Heavy Support zone($111,980-$105,820).
What do you think? Can Bitcoin break that Heavy Support zone($111,980-$105,820) in the end or not? Let me know your thoughts!
Cumulative Long Liquidation Leverage: $106,606-$105,463
Please respect each other's ideas and express them politely if you agree or disagree.
Bitcoin Analysis (BTCUSDT), 15-minute time frame.
Be sure to follow the updated ideas.
Do not forget to put a Stop loss for your positions (For every position you want to open).
Please follow your strategy and updates; this is just my Idea, and I will gladly see your ideas in this post.
Please do not forget the ✅' like'✅ button 🙏😊 & Share it with your friends; thanks, and Trade safe.
BTCUSDT) started rising from the Support zone($107,580-$106,700) and has now hit its Target at the Resistance zone($110,430-$109,380).Now the question is: will Bitcoin continue its short-term uptrend in the next few hours, or is it going to drop again? Stay with me to find out.
Bitcoin is trading near the Resistance zone($110,430-$109,380), Potential Reversal Zone(PRZ)[$111,000-$110,130], and Cumulative Short Liquidation Leverage($111,613-$110,542).
From an Elliott Wave perspective, it seems that Bitcoin is completing the wave C of an Expanding Flat Corrective Pattern(ABC/3-3-5).
Given that the S&P 500(
SPX) (which has recently been correlated with Bitcoin) is likely to drop when the U.S. market opens, I expect Bitcoin to resume its decline. This next drop might be the final push to break the Heavy Support zone($111,980-$105,820).What do you think? Can Bitcoin break that Heavy Support zone($111,980-$105,820) in the end or not? Let me know your thoughts!
Cumulative Long Liquidation Leverage: $106,606-$105,463
Please respect each other's ideas and express them politely if you agree or disagree.
Bitcoin Analysis (BTCUSDT), 15-minute time frame.
Be sure to follow the updated ideas.
Do not forget to put a Stop loss for your positions (For every position you want to open).
Please follow your strategy and updates; this is just my Idea, and I will gladly see your ideas in this post.
Please do not forget the ✅' like'✅ button 🙏😊 & Share it with your friends; thanks, and Trade safe.
עסקה פעילה
Trade was activated in Cumulative Short Liquidation Leverage($111,613-$110,542)הערה
Following yesterday’s analysis, Bitcoin started an upward move and touched its resistance levels one by one, even filling a small CME gap.
Now the question is whether Bitcoin can maintain this two-day uptrend or if it’s poised to drop again. Stay tuned.
Currently, Bitcoin is moving near a Resistance zone, Cumulative Short Liquidation Leverage, Resistance lines, and a monthly pivot point.
From a classic technical analysis standpoint on the one-hour chart, Bitcoin is forming a Rising Wedge Pattern. If it breaks below the lower lines of this wedge, that would be a strong signal of weakening in this short-term uptrend.
From an Elliott Wave perspective, it seems #BTC is forming a Double Three Correction(WXY) within this rising wedge, likely completing near the Resistance zone.
Note: As mentioned in previous posts, Bitcoin has had a high correlation with the SPX500 recently. If the S&P 500 starts a correction, we might see further downside for BTC as well.
In conclusion, I expect Bitcoin, after breaking the lower lines of the rising wedge, to potentially drop at least to around $109,733. If it breaks the support zone, further decline is possible.
Stop Loss: $113,020(Worst)
Another Note: Also keep in mind any geopolitical tensions—like those between the US and Venezuela🇻🇪—could impact the crypto market if they escalate. So factor in end-of-week market sentiment and volatility as well.
הערה
First Target Done($109,733), but I did not close my position, and I did Risk Free.It seems that tensions between Venezuela🇻🇪 and the USA have increased a bit.
The reaction of gold in the last hour or two could also be due to these tensions.
עסקה סגורה: הגיע לסטופ
Michael Saylor published a tweet, "Another Bitcoin buy incoming."As long as Bitcoin does not rise above $114,000, a reversal is possible from a technical analysis perspective.
Of course, in my analysis, I had given a warning of the risk-free, but I closed this analysis with a Stop Loss(SL) (transparency is important).

🎁 Free Real VIP Forex and Crypto Signals. Please visit:
🔗 t.me/ProTrader_365
🔗 t.me/ProTrader_365
פרסומים קשורים
כתב ויתור
המידע והפרסומים אינם מיועדים להיות, ואינם מהווים, ייעוץ או המלצה פיננסית, השקעתית, מסחרית או מכל סוג אחר המסופקת או מאושרת על ידי TradingView. קרא עוד ב־תנאי השימוש.
🎁 Free Real VIP Forex and Crypto Signals. Please visit:
🔗 t.me/ProTrader_365
🔗 t.me/ProTrader_365
פרסומים קשורים
כתב ויתור
המידע והפרסומים אינם מיועדים להיות, ואינם מהווים, ייעוץ או המלצה פיננסית, השקעתית, מסחרית או מכל סוג אחר המסופקת או מאושרת על ידי TradingView. קרא עוד ב־תנאי השימוש.