
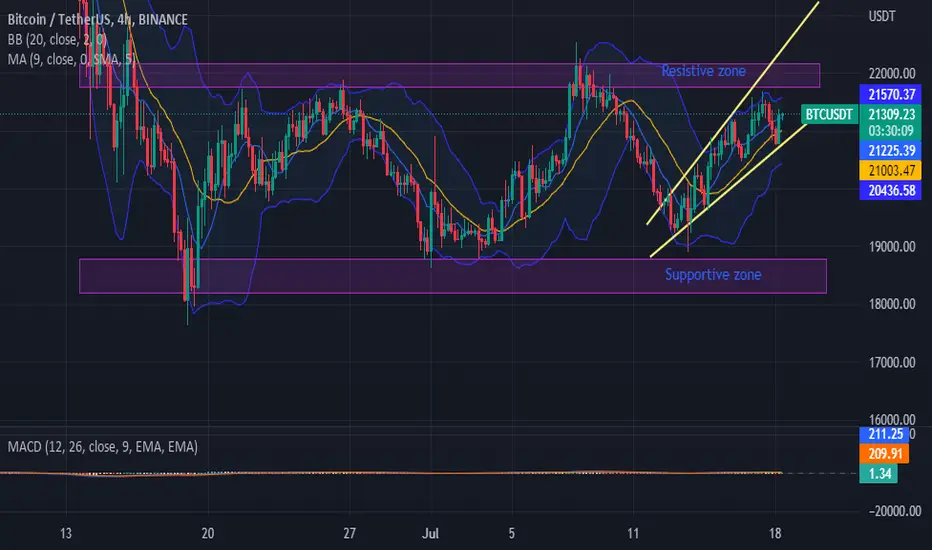
Observed rising wedge (yellow colour lines) pattern on BTCUSDT/4 hour chart
Upper side of the wedge is the resistive zone (21785-22170)/rough values
Below side of the wedge is the supportive zone (18150-18770)/rough values
Price either will hit resistive zone and go to down side(To continue rising wedge pattern)
OR
Price will break the resistive zone and go upside. (To break the market structure).
Upper side of the wedge is the resistive zone (21785-22170)/rough values
Below side of the wedge is the supportive zone (18150-18770)/rough values
Price either will hit resistive zone and go to down side(To continue rising wedge pattern)
OR
Price will break the resistive zone and go upside. (To break the market structure).

כתב ויתור
המידע והפרסומים אינם מיועדים להיות, ואינם מהווים, ייעוץ או המלצה פיננסית, השקעתית, מסחרית או מכל סוג אחר המסופקת או מאושרת על ידי TradingView. קרא עוד ב־תנאי השימוש.
כתב ויתור
המידע והפרסומים אינם מיועדים להיות, ואינם מהווים, ייעוץ או המלצה פיננסית, השקעתית, מסחרית או מכל סוג אחר המסופקת או מאושרת על ידי TradingView. קרא עוד ב־תנאי השימוש.