
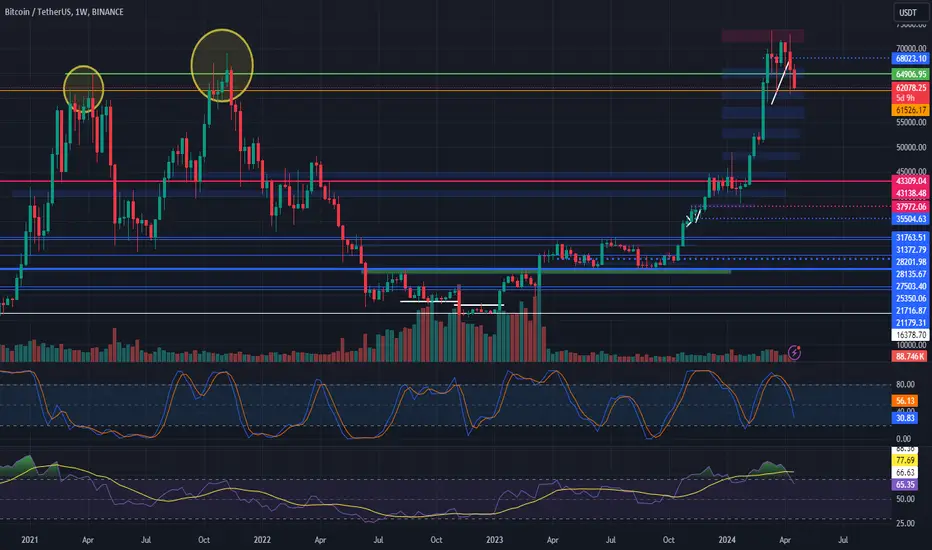
🔍 Technical Indicators:
Weekly RSI and Stochastic RSI: Both indicators are indicating a shift in momentum and signaling a reversal, suggesting that Bitcoin is entering a correction phase.
Price Action: Despite rejecting above $72,000, Bitcoin is currently being supported above $61,500 by the bulls. However, a drop below this level could lead to further downside.
🐻 Bearish Scenarios:
Support Levels: If Bitcoin breaks below $61,500, it may encounter support levels at $59,500, $52,000, and potentially $48,000.
Bears in Control: A drop below key support levels could signal increased bearish pressure and potentially lead to further price declines.
Weekly RSI and Stochastic RSI: Both indicators are indicating a shift in momentum and signaling a reversal, suggesting that Bitcoin is entering a correction phase.
Price Action: Despite rejecting above $72,000, Bitcoin is currently being supported above $61,500 by the bulls. However, a drop below this level could lead to further downside.
🐻 Bearish Scenarios:
Support Levels: If Bitcoin breaks below $61,500, it may encounter support levels at $59,500, $52,000, and potentially $48,000.
Bears in Control: A drop below key support levels could signal increased bearish pressure and potentially lead to further price declines.

כתב ויתור
המידע והפרסומים אינם מיועדים להיות, ואינם מהווים, ייעוץ או המלצה פיננסית, השקעתית, מסחרית או מכל סוג אחר המסופקת או מאושרת על ידי TradingView. קרא עוד ב־תנאי השימוש.
כתב ויתור
המידע והפרסומים אינם מיועדים להיות, ואינם מהווים, ייעוץ או המלצה פיננסית, השקעתית, מסחרית או מכל סוג אחר המסופקת או מאושרת על ידי TradingView. קרא עוד ב־תנאי השימוש.