
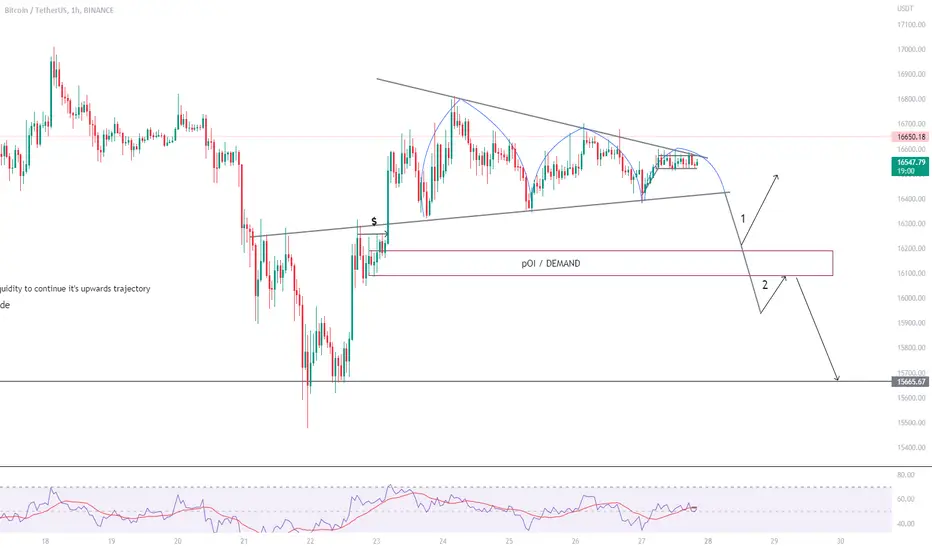
1- The triple top is a chart pattern used in technical analysis to predict a reversal in the price movement of an asset. A triple top indicates that the asset is no longer rallying and that lower prices are expected.
2- We have a level of demand below it, so the price must come to that level and have a big bounce to continue rising.
3- In scenario 2, the price will break the demand, retest it, and then continue to the lower resistance, where it will consolidate, then reach the 12 k area due to market fear.
2- We have a level of demand below it, so the price must come to that level and have a big bounce to continue rising.
3- In scenario 2, the price will break the demand, retest it, and then continue to the lower resistance, where it will consolidate, then reach the 12 k area due to market fear.

כתב ויתור
המידע והפרסומים אינם מיועדים להיות, ואינם מהווים, ייעוץ או המלצה פיננסית, השקעתית, מסחרית או מכל סוג אחר המסופקת או מאושרת על ידי TradingView. קרא עוד ב־תנאי השימוש.
כתב ויתור
המידע והפרסומים אינם מיועדים להיות, ואינם מהווים, ייעוץ או המלצה פיננסית, השקעתית, מסחרית או מכל סוג אחר המסופקת או מאושרת על ידי TradingView. קרא עוד ב־תנאי השימוש.