
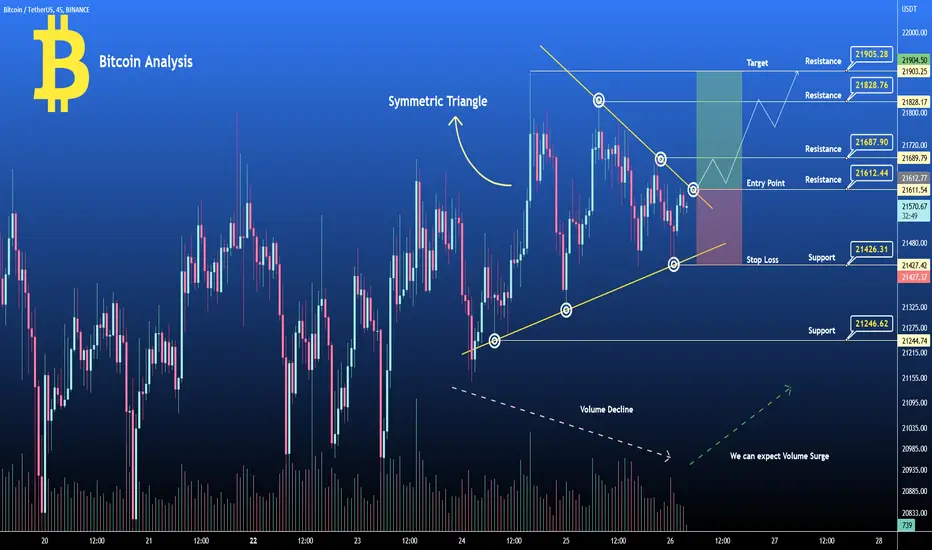
The above chart of Bitcoin ( BTCUSDT ) laid out the Symmetric triangle pattern. Currently, Bitcoin ( BTCUSDT ) is in the range of $21580. If the pattern continues, the price of Bitcoin ( BTCUSDT ) might reach the resistance levels of $21900, If the trend reverses, then the price of Bitcoin ( BTCUSDT ) may fall to $21420
RSI - Below 50
Trade Level
Buy Entry : $21615
Target : $21900
Stop Loss : $21420
Happy Trading $$$$
RSI - Below 50
Trade Level
Buy Entry : $21615
Target : $21900
Stop Loss : $21420
Happy Trading $$$$
הערה
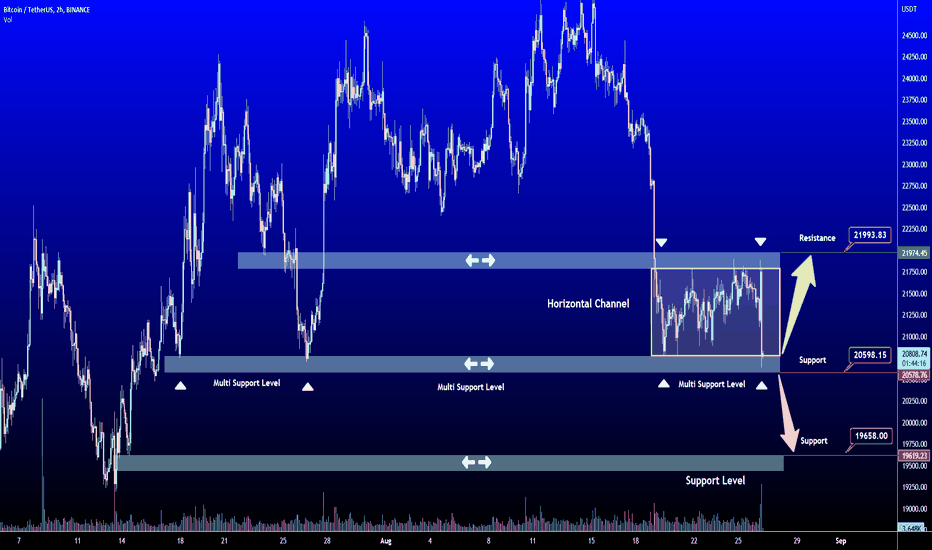
הערה
Fresh View Above
פרסומים קשורים
כתב ויתור
המידע והפרסומים אינם מיועדים להיות, ואינם מהווים, ייעוץ או המלצה פיננסית, השקעתית, מסחרית או מכל סוג אחר המסופקת או מאושרת על ידי TradingView. קרא עוד ב־תנאי השימוש.
פרסומים קשורים
כתב ויתור
המידע והפרסומים אינם מיועדים להיות, ואינם מהווים, ייעוץ או המלצה פיננסית, השקעתית, מסחרית או מכל סוג אחר המסופקת או מאושרת על ידי TradingView. קרא עוד ב־תנאי השימוש.