
Welcome to TradeCity Pro!
After a long break, let’s get back to Bitcoin analysis. This analysis is based on the daily timeframe.
Daily Timeframe
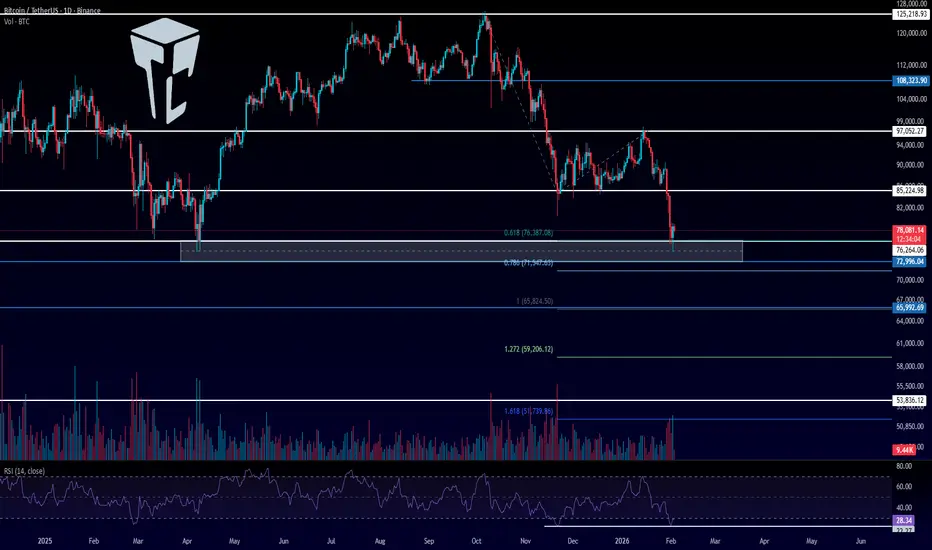
On the daily chart, Bitcoin’s trend turned bearish after stabilizing below 108,000, and the first bearish leg played out down to 85,000.
After a period of consolidation and a corrective move up to 97,000, Bitcoin started its next leg lower by breaking the 85,000 low, pushing price down to 76,000.
The 76,000 zone is a very important support area for Bitcoin and overlaps with the 0.618 Fibonacci Extension. We also have another support level around 72,000, so overall we can consider a major support range between 72,000 and 76,000.
A clean break of this zone would give us strong confirmation of a bearish trend, and if that happens, Bitcoin would officially enter a bearish cycle. As discussed before, this downside move could extend as far as 44,000.
At the same time, during this bearish leg, the RSI has dropped to its support around 22.27 and is now sitting at a momentum support level. If price continues to move lower without consolidation and RSI breaks below 22.27, we could see a very sharp sell-off.
Given the strength of the bearish trend, the next downward move could extend toward 65,000, 60,000, or even 53,000.
Personally, I’ll be looking to open short positions on a break below 76,000. However, if price fakes a breakdown in the 72,000–76,000 range, or finds support there and starts forming higher highs and higher lows, we can look for long opportunities on lower timeframes—because this 72k–76k zone is a very strong support area and won’t be easy to break.
❌ Disclaimer ❌
Trading futures is highly risky and dangerous. If you're not an expert, these triggers may not be suitable for you. You should first learn risk and capital management. You can also use the educational content from this channel.
Finally, these triggers reflect my personal opinions on price action, and the market may move completely against this analysis. So, do your own research before opening any position.
After a long break, let’s get back to Bitcoin analysis. This analysis is based on the daily timeframe.
Daily Timeframe
On the daily chart, Bitcoin’s trend turned bearish after stabilizing below 108,000, and the first bearish leg played out down to 85,000.
After a period of consolidation and a corrective move up to 97,000, Bitcoin started its next leg lower by breaking the 85,000 low, pushing price down to 76,000.
The 76,000 zone is a very important support area for Bitcoin and overlaps with the 0.618 Fibonacci Extension. We also have another support level around 72,000, so overall we can consider a major support range between 72,000 and 76,000.
A clean break of this zone would give us strong confirmation of a bearish trend, and if that happens, Bitcoin would officially enter a bearish cycle. As discussed before, this downside move could extend as far as 44,000.
At the same time, during this bearish leg, the RSI has dropped to its support around 22.27 and is now sitting at a momentum support level. If price continues to move lower without consolidation and RSI breaks below 22.27, we could see a very sharp sell-off.
Given the strength of the bearish trend, the next downward move could extend toward 65,000, 60,000, or even 53,000.
Personally, I’ll be looking to open short positions on a break below 76,000. However, if price fakes a breakdown in the 72,000–76,000 range, or finds support there and starts forming higher highs and higher lows, we can look for long opportunities on lower timeframes—because this 72k–76k zone is a very strong support area and won’t be easy to break.
❌ Disclaimer ❌
Trading futures is highly risky and dangerous. If you're not an expert, these triggers may not be suitable for you. You should first learn risk and capital management. You can also use the educational content from this channel.
Finally, these triggers reflect my personal opinions on price action, and the market may move completely against this analysis. So, do your own research before opening any position.

💥 Don’t Miss Out!
🏆 Trade & Earn : bitunix.com/register?vipCode=TCPINT
💰 Join the Telegram Channel Now: t.me/Tradecityproint
🤵 Business Contact: Tradecityproteam@gmail.com
🏆 Trade & Earn : bitunix.com/register?vipCode=TCPINT
💰 Join the Telegram Channel Now: t.me/Tradecityproint
🤵 Business Contact: Tradecityproteam@gmail.com
פרסומים קשורים
כתב ויתור
המידע והפרסומים אינם מיועדים להיות, ואינם מהווים, ייעוץ או המלצה פיננסית, השקעתית, מסחרית או מכל סוג אחר המסופקת או מאושרת על ידי TradingView. קרא עוד ב־תנאי השימוש.
💥 Don’t Miss Out!
🏆 Trade & Earn : bitunix.com/register?vipCode=TCPINT
💰 Join the Telegram Channel Now: t.me/Tradecityproint
🤵 Business Contact: Tradecityproteam@gmail.com
🏆 Trade & Earn : bitunix.com/register?vipCode=TCPINT
💰 Join the Telegram Channel Now: t.me/Tradecityproint
🤵 Business Contact: Tradecityproteam@gmail.com
פרסומים קשורים
כתב ויתור
המידע והפרסומים אינם מיועדים להיות, ואינם מהווים, ייעוץ או המלצה פיננסית, השקעתית, מסחרית או מכל סוג אחר המסופקת או מאושרת על ידי TradingView. קרא עוד ב־תנאי השימוש.