לונג
BitShares BTSBTC - Long Setup D1
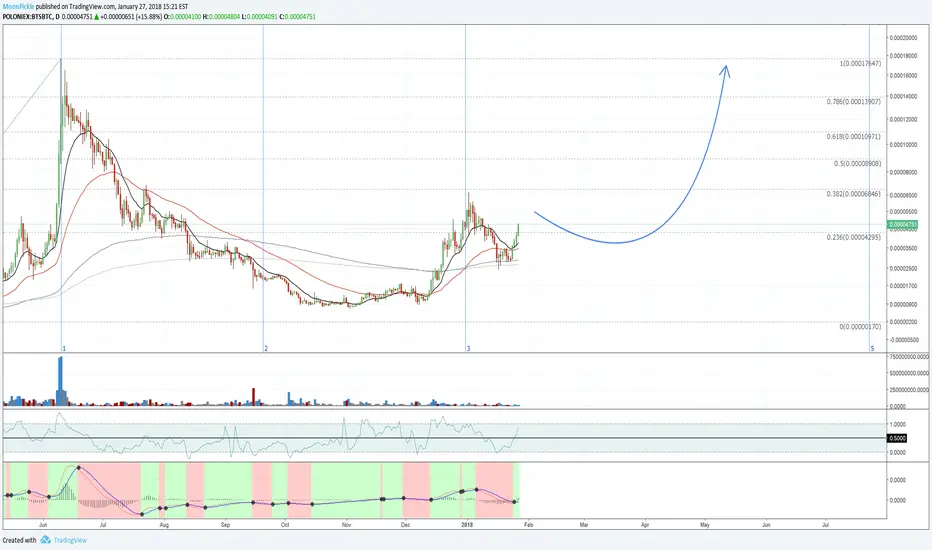
Use fib lines as targets - both time and price analysis are available on the chart.
Measure fib zone 1 to fib zone 2 to determine a time estimate for the formation on the right side of the cup chart pattern within fib zone 3 to fib zone 5.
RSI shows plenty of action on the upper +50 range, indicating bullish bias.
MACD shows fresh momentum.
No volume divergence.
Double bottom pattern shows minor correction is done.
EMA bounce up, no cross.
READY TO GO.
Measure fib zone 1 to fib zone 2 to determine a time estimate for the formation on the right side of the cup chart pattern within fib zone 3 to fib zone 5.
RSI shows plenty of action on the upper +50 range, indicating bullish bias.
MACD shows fresh momentum.
No volume divergence.
Double bottom pattern shows minor correction is done.
EMA bounce up, no cross.
READY TO GO.
עסקה פעילה
הערה
buy the break out, when price action leaves/breaks the downward channel (moving up)הערה
leaving the buy boxהערה
BOOMהערה
fractals on 4Hהערה
btc correction took bts with it, a double bottom has appeared on 4Hהפקודה בוטלה
btc
כתב ויתור
המידע והפרסומים אינם מיועדים להיות, ואינם מהווים, ייעוץ או המלצה פיננסית, השקעתית, מסחרית או מכל סוג אחר המסופקת או מאושרת על ידי TradingView. קרא עוד ב־תנאי השימוש.
כתב ויתור
המידע והפרסומים אינם מיועדים להיות, ואינם מהווים, ייעוץ או המלצה פיננסית, השקעתית, מסחרית או מכל סוג אחר המסופקת או מאושרת על ידי TradingView. קרא עוד ב־תנאי השימוש.