
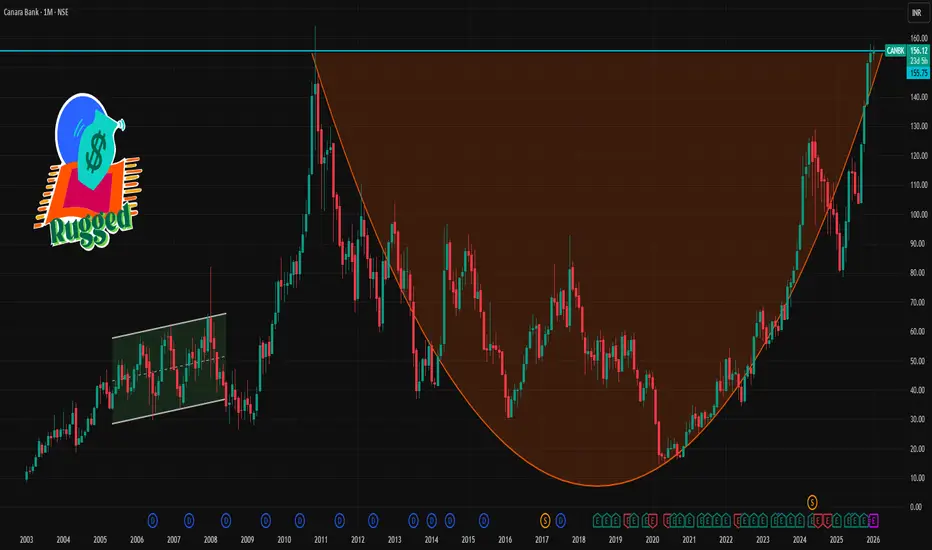
📊 Live Price Snapshot
Current market price: ~₹155 – ₹156 range on NSE.
🔁 1‑Month Key Support & Resistance Levels (based on recent pivot & price data)
📈 Resistance Levels (Upside)
₹156 – ₹157 — Immediate resistance (Pivot + recent highs).
₹157.4 – ₹158.8 — Next resistance zone near recent 52‑week high.
₹160 + — Further upside beyond range expansion (short‑term breakout level).
👉 As long as price remains above ₹156–₹157, short‑term bias stays positive.
📉 Support Levels (Downside)
₹153 – ₹154 — Near short‑term support / pivot collision zone.
₹151.5 – ₹152 — Key short‑term support from Fibonacci/MA area.
₹149 – ₹150 — Deeper support if stocks correct further.
💡 A break below ₹151 could signal mild pullback pressure; staying above ₹154–₹156 keeps the short‑term uptrend intact.
📊 Moving Averages & Trend Signals (1‑Month Context)
Daily & weekly SMAs/EMAs show bullish bias with price above most key moving averages.
RSI (~57) in bullish to neutral territory — not overbought, so room for continuation.
MACD and other momentum readings support mild bullish momentum.
🗒️ What This Means for Traders
✔️ Bullish bias near current levels as long as above the 1st support zone (~₹153–₹154).
✔️ Watch out for pivot breaks:
‑ Below ₹151 for a short‑term pullback,
‑ Above ₹158 for upside continuation.
✔️ Confirm with volume and intraday momentum before major positional decisions.
Current market price: ~₹155 – ₹156 range on NSE.
🔁 1‑Month Key Support & Resistance Levels (based on recent pivot & price data)
📈 Resistance Levels (Upside)
₹156 – ₹157 — Immediate resistance (Pivot + recent highs).
₹157.4 – ₹158.8 — Next resistance zone near recent 52‑week high.
₹160 + — Further upside beyond range expansion (short‑term breakout level).
👉 As long as price remains above ₹156–₹157, short‑term bias stays positive.
📉 Support Levels (Downside)
₹153 – ₹154 — Near short‑term support / pivot collision zone.
₹151.5 – ₹152 — Key short‑term support from Fibonacci/MA area.
₹149 – ₹150 — Deeper support if stocks correct further.
💡 A break below ₹151 could signal mild pullback pressure; staying above ₹154–₹156 keeps the short‑term uptrend intact.
📊 Moving Averages & Trend Signals (1‑Month Context)
Daily & weekly SMAs/EMAs show bullish bias with price above most key moving averages.
RSI (~57) in bullish to neutral territory — not overbought, so room for continuation.
MACD and other momentum readings support mild bullish momentum.
🗒️ What This Means for Traders
✔️ Bullish bias near current levels as long as above the 1st support zone (~₹153–₹154).
✔️ Watch out for pivot breaks:
‑ Below ₹151 for a short‑term pullback,
‑ Above ₹158 for upside continuation.
✔️ Confirm with volume and intraday momentum before major positional decisions.

Contact Knowledgehub for a detailed consultation: Dm on WhatsApp: [wa.link/a2o0kz]-
Phone No: [+91 93102 26243]-
Email: [tradingviewknowledgehub@gmail.com]---
-- Let’s achieve success together!
Phone No: [+91 93102 26243]-
Email: [tradingviewknowledgehub@gmail.com]---
-- Let’s achieve success together!
פרסומים קשורים
כתב ויתור
המידע והפרסומים אינם מיועדים להיות, ואינם מהווים, ייעוץ או המלצה פיננסית, השקעתית, מסחרית או מכל סוג אחר המסופקת או מאושרת על ידי TradingView. קרא עוד ב־תנאי השימוש.
Contact Knowledgehub for a detailed consultation: Dm on WhatsApp: [wa.link/a2o0kz]-
Phone No: [+91 93102 26243]-
Email: [tradingviewknowledgehub@gmail.com]---
-- Let’s achieve success together!
Phone No: [+91 93102 26243]-
Email: [tradingviewknowledgehub@gmail.com]---
-- Let’s achieve success together!
פרסומים קשורים
כתב ויתור
המידע והפרסומים אינם מיועדים להיות, ואינם מהווים, ייעוץ או המלצה פיננסית, השקעתית, מסחרית או מכל סוג אחר המסופקת או מאושרת על ידי TradingView. קרא עוד ב־תנאי השימוש.