
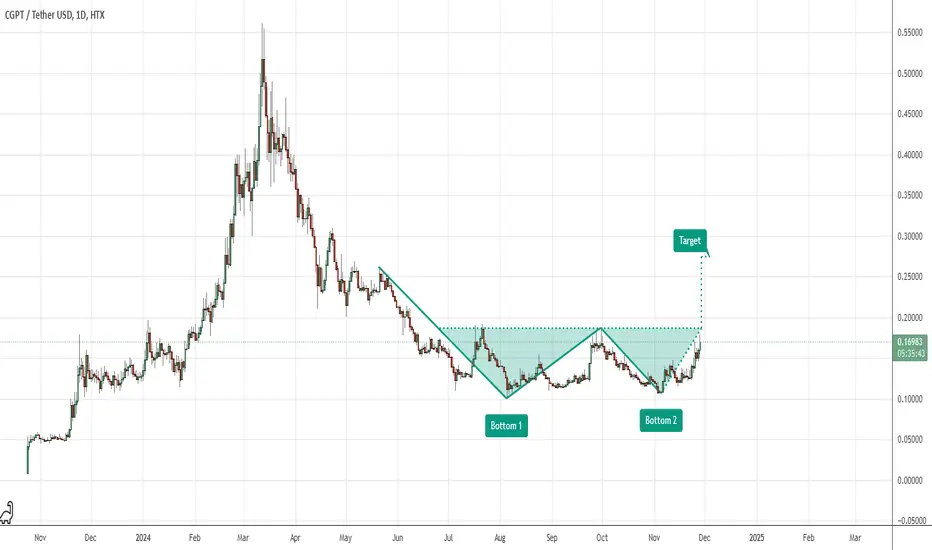
The chart depicts a double-bottom pattern, signaling a potential bullish reversal. The breakout above the neckline (~$0.17) confirms the pattern, with a target projected near $0.30 based on the height of the formation. Strong support lies at $0.15, while resistance levels exist around $0.22 and $0.25. Sustained momentum could achieve the target.

כתב ויתור
המידע והפרסומים אינם מיועדים להיות, ואינם מהווים, ייעוץ או המלצה פיננסית, השקעתית, מסחרית או מכל סוג אחר המסופקת או מאושרת על ידי TradingView. קרא עוד ב־תנאי השימוש.
כתב ויתור
המידע והפרסומים אינם מיועדים להיות, ואינם מהווים, ייעוץ או המלצה פיננסית, השקעתית, מסחרית או מכל סוג אחר המסופקת או מאושרת על ידי TradingView. קרא עוד ב־תנאי השימוש.